XEMBTC trade ideas

XEM/NEM lots of potentialXEM looks like it's got decent support. Don't bet the house. From my youtube video research a while back, xem seems like a solid project. Lot's of upside potential.


XEM - a perfect Wycoff market cycle from the booksI will be watching the moment when the candles touch the main support..
NEM/XEM is a great coin - i do NOT expect it to go down when that happens :-)
any information when catapult is going to be released would be fine though..

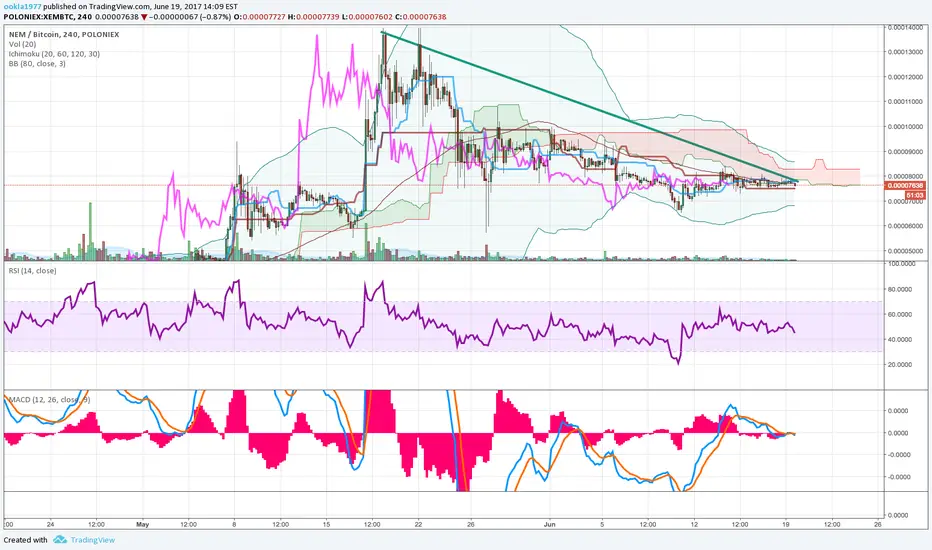
Xem Mid MoveFor Enter Now 0.00007778
Short Target =0.00008263
Mid Target=0.00009051
Long Target=0.00009839
Totally Gain 27 %
Capital management is recommended
We ask Allaah to reconcile and repay


XEM/Nem is about to breakout!Nem is about to start an Elliot Wave 3. If the price drops below first trending line, it might test the Support line again before the move!

XEM / NEM wave 5After reading some XEM questions in the public chat I decided to chart down the possible XEM wave 5 preparation.
I still think XEM is in an ongoing correction from the big push it just had. It is under the 6 and 12 hour clouds with the indicators still pointing downwards. It might go up, reach the cloud but then crash down to the 618 fib level. From there I see it trying to shake out weak hands and pretty much pull off a LTC, have a long consolidation/downward movement, make bagholders tired of it and then start pushing up for a wave 5. The wave 5 will not be as big as the wave 3. Expecting it to hit around 20000 sats FOMO a bit higher maybe in the next upcoming weeks.

Lighting Kumo over Thunder Kumo on 15mI'm trying to follow 2 kumos on 15m charts. Let's see what happens in 6 hours.

XEM extremely good coinAfter making insane gains this year. I expect XEM to rise even more. Its extremely popular and seems to have hit its support level.


XEM NEM - Impulse waveTake it for a ride. Honestly I have no clear ideas & opinion about the insights of Nem.
Here, the idea, is just the repetition of the wave. The crosslines point in the support + the rendez-vous and the overall trend line make me confident.
The drawing part is just a cliché.
By following Fib lines, we can expect at least 12000 as a target, but we need more data to know the real potential . x2 is an option.
Focus on settings, timing & variables is needed here because we want to surf on a period of a wave then get out before the scum bath.
I will update.
Ideas & corrections are welcome.
Cheers

XEM/BTC: Harmonic and Fib Extention Safer buy above the resistance line. Up trend remains Intact.
Both Bat and Fib rations shows a clear sign to go long. As trades doesn't work with formulas put SL trigger.
NEM 0.29% is fairly stable at the moment, they plan to release Catapult maybe August. I think that will push the price up again, so maybe its a cheap buy now. For more details on CATAPULT look at this video. (Long Term)
Target 1: 9992 Target 2: 11019
www.youtube.com

XEMBTC - slow decay for consolidationA bit late on this call, but I see XEMBTC continuing a decay into the target zone before looking at re-entry. It had a great market cycle, so I see this move as necessary to long term growth. Could trade the channel on the way down if you're skilled at such things.
POLONIEX:XEMBTC


NEM/XEM ARISE!!!After forming a double top pattern, the inevitable fall came and XEM / NEM was forgotten by many, being the fourth most important coin in the ranking of the crypto market.
Following Bulkowski's theory about the Adam & Adam double top pattern, where levels A, B and C are marked, and then take a change in the trend towards a bull market. coinmarketcap.com
We will have to get around the kumo and not get into it, to achieve the target price.
As one of my 3 favorite coins and thanks to her having done in February of this year the best trade so far, I hope we continue to give us great joys.
As always, greetings to all and thank the followers for the feedback, likes and good vibes.
Stay strong, keep bullish!
Thank you


This train is movingXEM
looks like we are getting a move here
The target if we gather momentum and volume should be the Bollinger bands (note it is adjusted settings for strong moves)
Please do your own research


