STRATBTC 1D Adam/Eve Early Edge to Edge Bullish Thesis:
-Adam/Eve pattern anticipates potential bottom/reversal
-Yesterday candle close inside cloud creates partially valid Ichimoku edge to edge setup
Risk/Counter Thesis:
-TK cross has not happened yet and may not happen
-Bullish kumo twist has not happened yet and may not happen
-Altcoin/Bittrex/Low Liquidity/Macro Landscape Bearish
Entry:
0.00000505 (current bid)
Stop Placement:
Greater than ATR (22 sats) below current price
Invalidation of Adam/Eve pattern
Early Close condition:
Can be manually stopped for reduced R if closes below cloud
XEMBTC trade ideas

XEM/BTCKeep it simple!
Looking at XEM on the weekly, we have yet to see a strong hold of support and a higher low play. Because of this I see XEM going lower, and possible testing the buy range (Green box), before the rise can begin. This is an untested range which many alts are following. The 31 Sat's range offers a great risk to reward ratio. From here we can see XEM test the previous support levels which are now resistance. These are the orange boxes. At these levels I would take out around 10-20% of my trade.

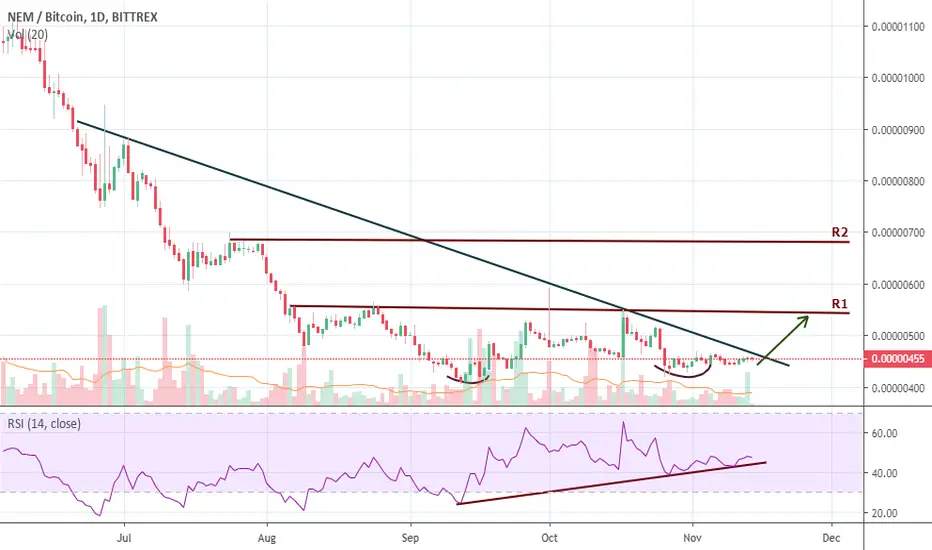
NEM forming a DOUBLE BOTTOM REVERSAL PATTERNBased on the chart, NEM probably bottomed at 410-420 sats. It perfectly held the previous low when the price retest the support/previous low at 410-420 sats.
In addition, RSI shows a strong sign that it is now in an upward trend.
Now, if the price breaks the trendline it will test the 1st resistance line at 550 sats.
Just remember don't forget to set up a stop-loss because most of the ALTCOINS follow the BITCOIN movement.
Hit Like and Follow me for more updates!
Happy Trading!
Please do your charting and research.
NEM triangle detectedRecently we saw isns which did not work. Now apparently it's a giant triangle. You decide what position to take long or short.

This caterpillar will become a beautiful butterfly?since we know that all XEM users will receive 1 to 1 catapult tokens, and at the same time, the XEM network will continue to function, we come to the conclusion that a bearish trend will end soon
Paired with the dollar, we can see consolidation.
If in the next month, there will be no catch from Bitcoin, we should see a breakthrough, a falling wedge
The caterpillar will again become a butterfly

Alt Season - Calm before the stormPretty large R/R here considering the lower parameters of price for alt coins.
500 satoshi buy in for a tp of 10000 satoshis, 9500sat per NEM. 20x return.


$XEM wedging out | #ALT season? #cryptocurrency #bitcoin #btcCould be the long awaited bottoming out ... (see related strategy)
I am going to call a long with a SL at the low. Keep your SL tight!

XEMBTC formed a bullish butterfly | Upto 193% from herePriceline of NEM / Bitcoin cryptocurrency has formed a bullish butterfly pattern and entered in potential reversal zone to hit the sell targets soon insha Allah.
The price action is hitting the strong support at 0.00000477 sats which is not broken since 2016.
After hitting the support the MACD turned weak bearish from strong bearish.
RSI is already oversold.
Stochastic is oversold but did not give bull cross so for safe trade we can wait for bull cross from stochastic.
I have used Fibonacci sequence to set the targets:
Buy between: 0.00000495 to 0.00000189
Sell between: 0.00000728 to 0.00001298
Regards,
Atif Akbar (moon333)


XEM chop triangle in full motionXEM should be bought at horizontal or if the price breaks trough the diagonal.
So far it is not worth holding a position in it, yet.
Be patient and trade the triangle.

XEM next long opportunity #nem #bitcoin $xem $xembtcThe falling wedge is close to an end. Placed some long orders with a close SL.

XEM BTC longWe have a strong setup to go long on a bounce. Trade with care as any movement with BTC will follow with a seel of XEM.
Buying this bounce with a tight stop loss may give you a massive R/R
Trade this as a short time trade. If you are HODL'er it is a time to get some XEM into your portfolio.

XEMBTC bottoming out after very long bear marketXEMBTC is bottoming out after a very long bear market
RSI and MACD are making higher lows, but price is not following which means a bullish scenario
Expect a breakout with volume and a retest with a higher low which forms an inverse head and shoulders
TP1 1050
TP2 1300
TP3 2000

Resistance line to be broken so that Alt season can beginThis XEM chart tells us when Alt season can begin. If we watch it carefully, whenever has been tested as support and held, Alt season begun. When tested as resistance and couldn't be broke, all Alts fell heavily. Bitcoin runs the show and its near term price action will dictate if Altcoins would be a good trade. If Bitcoin price wwill range for several weeks in the actual level, it could give Alts a chance to breath. So pay attention to the following resistance line and be ready.

Altcoin season: XEMBTCSo many falling wedge patterns within the altcoin market. XEMBTC looks promising for a take off to the 200w EMA.


Potential bounce @0.00000800 levelHistoric RSI low @ 10.22, coincides with potential 0.886 retracement. Bounce to 50% level which has confluence with previous high.

XEMBTC formation of gartley completedThe priceline has completed the formation of gartley pattern and entered in PRZ area. The 50MA support is already in potential reversal zone and from here the price action can take bullish divergence soon insha Allah.
The targets are:
Buy between: 0.00001059 to 0.00000914
Sell between: 0.00001176 to 0.00001453
Regards,
Atif Akbar (moon333)

Before you buy XEMJust ask yourself the question. What would happen if the price would drop just one sat below the line? Will it go back up, like nothing happened?
Or will it activate all the stops that have been accumulating over the past month..
Or will it surge down in a stoploss pool of blood.
Or will it bounce on a discreet level meters below the line of doom catching you off guard again.
You probably did it right? Bought at around 1050 and put your stoploss at 1042 or lower.
Ill place my buy at around 867 and ride the reaction back up. Thank you very much.
*This is not financial advice*


