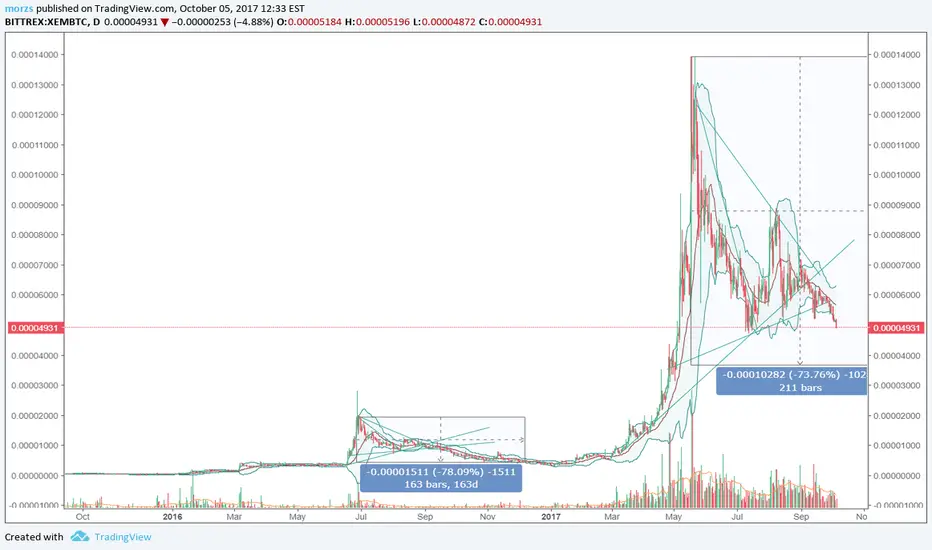
Do you trust NEM ?(how many X can it does?)Now NEW has many positive news , hold confeneces , meet ups. During 3 months it does not fall below 0.00005 support zone and made correction only 50% unlike other coins ( 80-90 %) I guess it has wonderful long perspective but i wait for best entry on 0.00003 lvl
SEPTEMBER 23 / #XEM / block chain MeetUp / Meeting with Jeff MacDonald Berlin
SEPTEMBER 25 / #XEM / Discussion meeting @nem and ex-coo @hsbc private bank
OCTOBER 3 / #XEM / Forum blockchain solutions Barcelona
OCTOBER 17 / # XEM / meeting 2017 Australia
OCTOBER 22 / # XEM / 20/20 conference in Las Vegas
October 24 / #XEM / blockchain Summit in Dubai
+ICO on NEM's base - COMSA
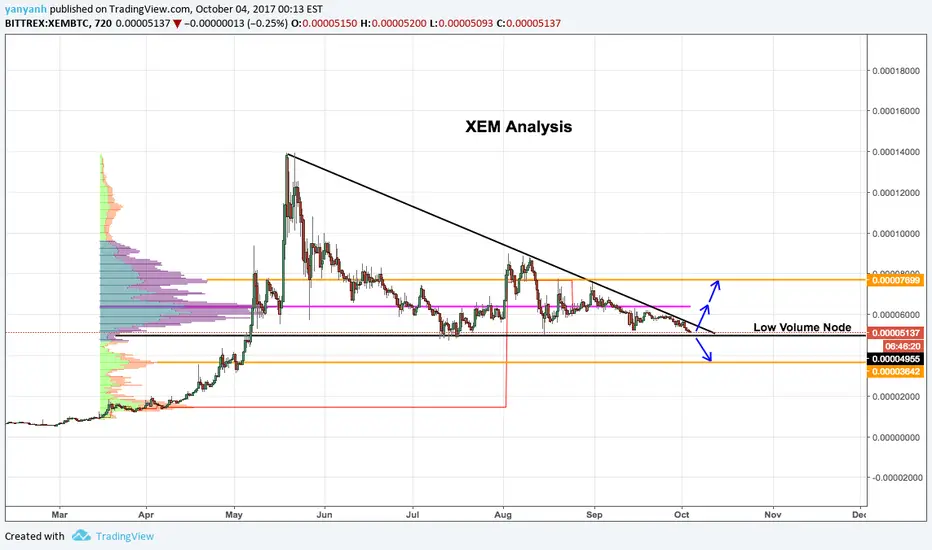
XEMBTC trade ideas


Future of New Economy Movement (NEM-XEM)By looking at technical analysis i made on this currency, we can observe that it's moving in triangle and soon it's going to break it. We may see rapid upward movement or new hollow. In my opinion this coin has big future, because it has series of news in October and it may reach x2 or even x3 in price. Also it's approaching to 2/1 Gann Fan level, which means upward movement.
What I recommend is to buy and hold XEMBTC for 1 month approximately or you may buy it higher soon.


XEM oversold on dailyThis is an interesting one , XEM is oversold on daily level , finds itself on a strong old support , if it breaks it might go to FIB level support. But if it goes thru resistance XEM is very Bull. Very interesting to see what happens , i'm bullish on XEM because it has a lot of good news to come and it's already oversold and on support , so let's see what happens

$XEM Short SetupXEM is about to break support to the downside -> Opportunity for a short with the target of the next HVN.
Entry: 0.00004641
Target: 0.00003642
Stop: 0.00005144
Risk/Reward: 2.04

$XEM BreakoutHuge triangle in XEM. Further down grind or breakout to test VPOC and HVN. Low volume node as support to bounce off.
NEM looking very bullish!Bullish points:
1) Ascending triangle
2) Stochastic RSI oversold
3) A - B - C correction seems to be done. After a correction we all know what follows.
4) Wave 5 has started to be placed in. We have seen that in the crypto market wave 5 tends to be extends, thus we are looking at massive profits!


XEM/BTC up trendThe look looks like it is moving towards a convergence, indicating that it may be reversing in the near future, with the expected break in the range of 0.00005300-0.000005500.
Expected profit:
- target 1: 0.00007200
- target 2: 0.00008800

XEM 25% Pump IncomingXEM is about to break downtrend resistance and head up to the previous orderbook zone // ~25% increase

I expect a second correction wave at the XEMBTC exchange rate...I expect a second correction wave at the XEMBTC exchange rate. This second half wave would complete the two wave correction movements. The correction level for further decrease is the level of 0.00002976 levels. Then, the exchange rate may begin with a slow rise. Then, reaching the second steep ATR axis, it accelerates to reach the level of 0.00007316 levels. This is the primary purpose of the subsequent rise. Since the underlying rule of ascending wave movements is that the movements in the correction phase reach the doubling of the drifting phase, so the exchange rate may also reach the second target price of 0.00009433


XEM/BTC waiting for breakout & FundamentalsWaiting for XEM to breakout of flag, entering the market now while its quite beacuse we have confrences on 03-16-17-22 of October, very good possibility of good news coming when you attend 4 confrences in one month in multiple countries.

XEM-BTC but what if?So, what we have.
On the daily chat, we can see a triangle. Will the figure work out in a plus? Hm... if it works, the we are waiting for a good profit. Also, a good news predicts in the near future growth for XEM. What do you think? So i'll keep an eye out for this chart.
join me in my chat
t.me


XEMBTC (Bittrex) : Give it some time for profitsXEM downtrend is coming to a finish, but it still has to test support on the major historic line (on purple). Check for confirmation, and then enjoy some gains this weekend.
