XEMBTC is strong buy at this low rate, 750% PotentialNEM (XEM)
Rank on Coinmarketcap - 18
Market Cap - $901,749,602 USD = 133,579 BTC
------------------------------------------------------------
RSI @ 33
ATH 13750
Current 1534
Buy at CMP or place order around 1400
------------------------------------------------------------
TP1=2369
TP2=3077
TP3=4606
TP4=7588
TP5=ATH
Stop loss- If daily candle close below 1300
------------------------------------------------------------
Trade at own risk
XEMBTC trade ideas

XEM been SLEEPIN, and ready to launch. Just waitXEMBTC on Bittrex shows the History of its booming capabilities.
This is looking like an ideal buy right here. history shows it does mega pumps once it reaches these lows.
Dont say i didnt warn you.
TIme table is subjective to change but look for next spring ~March 2019 -- April 2019 for the fireworks to have really shown its true colors

XEM/BTC Next WaveI know may be some of you think lm a crazy bcause this setup but l use this setup with technical analysis l dont have enough news for XEM for now but l have 2 news and 1 hot news prntscr.com
Buy
1350-1300
Buy Back
700-500
Sell
3157
4800
6315
7400
10000
11784
dont worry l will make short term setup for XEM too you can follow my account and get notif

$XEM buy.lmao.. bit more risky cuz -50% down of the current value theres low volume.. but bullish divergence everywhere.


Two ermanometric triangles...showing here the same possible reversal week 24-30 September. Ermanometry in case of XEM does not work however so precise in comparison to BTCUSD weekly chart (after all time high made by Bitcoin - before that time ermanometric calculations seem not to work properly). But XEMBTC chart suggests possible nearing of ending this bear market here. Some spike up should be drawed by market forces here. The only question is when.


Accumulate today, technical entry before Sep12-13 F-date.Hey everyone, this looks like an ideal, entry and accumulation for those that believe in XEM.
This is the most technical trade i have seen in a while.
We have a lot of trend line converging on a specific price level.
The 4-5 wave on descending channel was broken. And we having almost little sellers left.
If price can;t go any lower, it usually going to go the opposite direction.
Larger volumes on a flat price line with little volatility is a good indication that a reversal is more likely, the downfall.
And with a current stop loss of about 4-5% anyone who wants to get some XEM should do so.
A rare fractal event is also fast approaching between Sep 12- 13, and the next one is in nov 18th.
Stop losses are identified, in case we are wrong in our assessment of this accumulation.
Good luck everyone ;)
**LEGENDS**
BLUE = Bear/Resistance
Yellow = Bull/ Support
~Explore the chart for possible scenarios of price actions - use zoom and scroll for better view.~
/*This information is not a recommendation to buy or sell. It is to be used for educational purposes only.*/
If you want your coin to be analysed, JUST ask.
If you got a question, ASK away!
And please keep those Stop losses in place!
Fractal dates are moments of interest, where price and time collide to create oscillation.
These fractal events are identified as dotted vertical lines.
Thank you,
Ajion
XEM: 109189300
XEM: NC64UFOWRO6AVMWFV2BFX2NT6W2GURK2EOX6FFMZ
If you support the work i do, and you believe in building a transparent and open crypto fund.

Xem/BtcBuy
1400-1200
Sell
1800
2510
3150
4100
Mid-Long Term
Dont worry Btc will test resist 6800 and if cant break will correction to 6k-5800 and will test again 6800 if break Btc will go moon
Sl 1000
You can hold without Sl if u want
Dont forget to like and follow to get new updates about crypto

$XEMBTC: Remains on Watchlist; Could be getting interesting hereSome has asked my thoughts on $XEMBTC.
Chart remains in correction territory as it continues consolidation.
Interestingly enough, it's back at the support levels from December 2017,
so there could be some potential for history to repeat itself with a bounce.
Again, right now it's trending sideways...
Last week it appeared things were going to turn around for the stock;
however, yesterday turned that thinking back around.
At the moment, I'd like to see that chart turn 0.0....1560 into support and be
able to hold that level for a retracement back towards the 0.0....1777 area.
I do anticipate a squeeze on this stock to move abruptly in either direction;
however, once again, if history repeats itself - you can see how the stock reacted
back in December around this same territory :-8

$XEMBTC: Start of the Trend?This is what we discussed a few days ago. Here we go with... 0.0...1558 turning into support.

XEM at great support for a major bull runA stronger support would be 900 satoshi. keep eyes on this for now or enter with a stoploss and re-eneter at 900 if the stoploss got triggered.

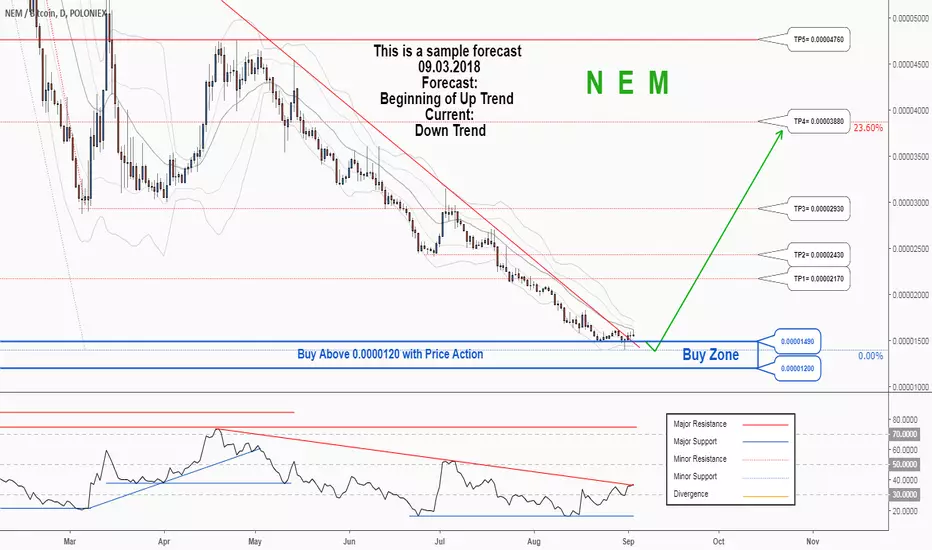
There is a possibility for the beginning of an uptrend in XEMBTCTechnical analysis:
. NEM/BITCOIN is in a downtrend and the beginning of uptrend is expected.
. The price is below the 21-Day WEMA which acts as a dynamic resistance.
. The RSI is at 37.
. While the RSI and the price downtrend in the Daily chart are not broken, bearish wave in price would continue .
Trading suggestion:
. There is a possibility of temporary retracement to suggested support zone (0.00001490 to 0.00001200). if so, traders can set orders based on Price Action and expect to reach short-term targets.
Beginning of entry zone (0.00001490)
Ending of entry zone (0.00001200)
Entry signal:
Signal to enter the market occurs when the price comes to "Buy zone" then forms one of the reversal patterns, whether "Bullish Engulfing" , "Hammer" or "Valley" in other words,
NO entry signal when the price comes to the zone BUT after any of the reversal patterns is formed in the zone.
To learn more about "Entry signal" and the special version of our "Price Action" strategy FOLLOW our lessons:
Take Profits:
TP1= @ 0.00002170
TP2= @ 0.00002430
TP3= @ 0.00002930
TP4= @ 0.00003880
TP5= @ 0.00004760
TP6= @ 0.00005400
TP7= @ 0.00006640
TP8= @ 0.00008610
TP9= @ 0.00009630
TP10= @ 0.00011880
TP11= Free

XEM can break down channel - BullXEM started a movement of accumulation. This may precede a large high. Wait for the channel to be broken and targets can be reached. Remember to make partial profits

XEMBTC Prepare for the launch, will be very fast!XEMBTC Prepare for the launch, will be very fast!
I Will buy when the EMA crosses and ADX give the trigger!
Any sugestions?

[XEM/BTC] NEM COULD BREAK HIGH SOON [ X2-X4 POTENTIAL PROFIT]#XEM / BTC ( Binance, Bittrex, Poloniex )
Buy Range : 0.00001500
Stop Loss : Not recommend
Target 1 : 3243
Target 2 : 5500
Target 3 : 7000
WEEKLY CHART
- SAR still negative but any pump/good performance on 4h/daily chart can swap this into positive ( Neutral )
- RSI touched oversold zone and that's a good point to buy for hold ( Positive )
4H CHART
- RSI pointing up ( Positive )
- MACD going up stongly ( Positive )
- OBV pointing up ( Positive )
- CCI turned into Green ( positive )
- CMF going up ( positive )
- Ichimoku Cloud broken and next hours will be important to see if can stay above ( neutral )
CONCLUSION
NEM/XEM is a classic coin which got a very high potential to explode on a bull market. This coin is on its classical support zone and is showing very good performance on short-timeframes like other altcoins.
On long-timeframes there aren't much useful activity but prices give us a very good risk/reward for mid-long term trade.
Be patient and manage correctly your funds


Long on XEM for a couple daysShort term Buy opportunity
Enter with caution SL 1430
Proper enter 1610
Risk free enter 1810

New Economy Movement Falling Wedge Reversal..XEM/BTC GAINS!XEM is another top altcoin which has been in a big bearish market as we can see and we can see that it has been making a reversal pattern in its bear movement and now we are at our ultimate bottoms, however we can see that we are still inside the wedge and there is still room for downward movement so we should wait for the bounce from our trend line which will get us out of the wedge and the green price zones are our targets and the blue prices are our next supports if we go for more downward movement.
As I am more of mid/long term trader the price we have now is pretty attractive for me and may be a buy in however if you are for instagains then you should probably wait for it to get out of the wedge.
Bullish inedicators:
-EWO - we had a bearish divergence which got rejected by the green wave circled in the graph, and now we are having bullish divergence
-STOCH - has started moving from oversold are and now we are going up
-MACD - strong bullish divergence on MACD (trend has made 3 touches and now we are going for the 4th one, if we bounce from this touch this is a very strong bullish divergence we are having on MACD)
Details of the trade:
Targets:
1. 0.00002029 BTC
2. 0.00002228 BTC
3. 0.00002532 BTC
4. 0.00002735 BTC
Stop loss: well if we are joining the trade now then our stop loss should be 0.00001490 BTC and we can sell there and buy at lower prices(the blue prices shown)
Buy-in: 0.00001495-0.000016 BTC and if we go for downward movement inside the wedge then you are free to buy at the blue prices.
Good Luck, Traders! #moon #mooncommunity


XEMBTC Potential Weekly SupportXEMBTC has been on a downtrend along with all cryptocurrency assets since January, this week we are looking at some relief on the selling pressure. Coins are randomly pumping out of nowhere after being exhausted and taking this in account along with XEM being a solid platform, we believe to have a small swing trade opportunity. ADX is on all time low, and considering that volatility is all time low too, it could indicate a sudden move up which is something that goes accord to the "story" of the current cryptocurrency market, my own targets are posted below.
Buy: 0.00001670-0.00001680 ; SL: 0.00001572
Target 1: 0.00001749; Target 2: 0.00001799; Target 3: 0.00001839
Disclaimer
Cryptocue is not providing individually tailored investment advice and is not taking subscribers personal circumstances into consideration when discussing investments. Investment involves a high degree of risk and should be considered only by persons who can afford to sustain a loss of their entire position. Investors should consult their registered financial adviser before investing.
Cryptocue is not registered to provide investment advice and is simply providing an opinion, giving a particular experience. Information contained here is not an offer or solicitation to buy, hold, or sell any security.
Cryptocue is not a broker-dealer or financial adviser and is not affiliated with an investment advisory firm and does not engage in activities that would require such registration.
Cryptocue and/or any others affiliated with CryptoCue, are not responsible for any gains or losses that result from the opinions expressed herein.
Cryptocue makes no representation as to the completeness, accuracy, or timeliness of the material provided and all materials are subject to change without notice. Opinions discussed herein have not been reviewed by the securities and exchange commission or any state securities regulatory authority. Furthermore, in cases of ICO the foregoing authorities have not confirmed the accuracy or determined the adequacy of the ICO offering documents

$XEM trendline TAbig time frame indicators are all looking bullish since long ago tho
waiting for the bounce
