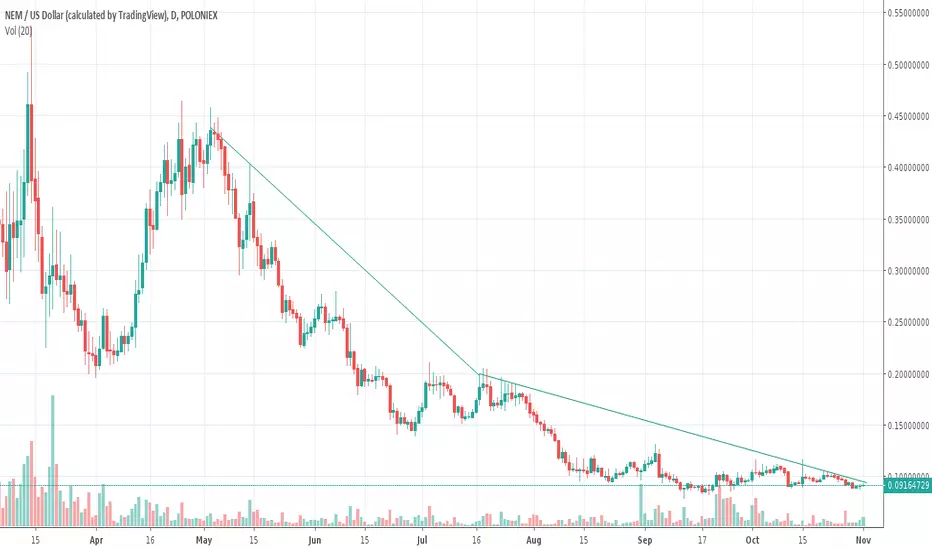
XEM / USD pricing in July network upgradesThe 12+ month down trend is over.
Higher highs and higher lows + momentum indicators on Monthly timeframes have scrapped the floor of ATL's and are now slowly exiting over-sold territory.
Just like BTC halving and ETH inflation reductions with network upgrades, XEM is only 3 months away from the very large "catapult" upgrade and this is starting to be priced in.
Conventionally after such a long bear market, we should have seen a flat sideways accumulation period.
However since king BTC is pushing higher and faster then expected, I anticipate the XEM/USD and many mid-cap Alts to be under an 'aggressive' accumulation which floats up.
12c will be a battle and a required pause to reset various indicators, then it's onto the next fib level.
Alternatively, if the current descending wedge on the daily does break down (ETA for wedge breakout is any time now), then expect 5c retest and a more traditional flat accumulation range between 5c-10c for a few more months.
XEMUSD trade ideas

NEM / USD Technical Analysis: Regaining TrustNEM / USD Short-term price analysis
The NEM / USD pair has a strong short-term bullish trading bias, with the cryptocurrency recently advancing to a new monthly trading high.
The large inverted head and shoulders pattern on the four-hour time frame has now been triggered after a brief period of consolidation around the neckline of the pattern.
Technical indicators on the four-hour time frame remain bullish and continue to generate a strong buy signal.
Pattern Watch
Traders should note that the overall upside objective of the inverted head and shoulders pattern would take the XEM / USD pair towards the January 8th swing-high.
Relative Strength Index
The RSI indicator is bullish on the four-hour time frame, although it is approaching overbought conditions.
MACD Indicator
The MACD indicator on the four-hour time frame is bullish and continues to generate a strong buy signal.
Fundamental Analysis
The spike of positive sentiments towards NEM, is most likely connected with the fact that the project should announce the roadmap for Catapult, as was promised, by the end of Q1 2019. Catapult has been long awaited by the community and should bring additional functionality to the NEM blockchain including trusted decentralized swaps, multi-faceted transactions, multi-level multi-signature transactions, automatic fee payment and more.
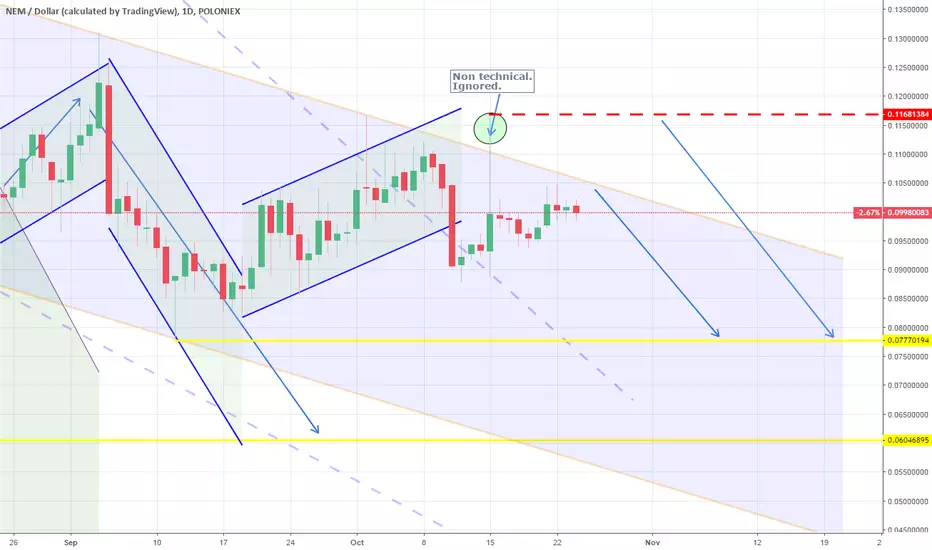
NEM / USD Medium-term price analysis
NEM has a bullish medium-term trading bias, with the cryptocurrency moving closer to its trend defining 200-day moving average.
The daily time frame shows a bullish breakout from a descending price channel, which the cryptocurrency had been trapped inside since December of last year.
Technical indicators on the daily time frame are also bullish, although they appear more overstretched than the four-hour time frame.
Pattern Watch
The overall upside objective of the descending price channel on the daily time frame would take the NEM / USD pair towards the November 29th swing-high.
Relative Strength Index
The RSI indicator on the daily time frame is bullish, although it has moved into overbought territory.
MACD Indicator
The MACD Indicator is bullish on the daily time frame, although bearish price divergence is starting to emerge.
Fundamental Analysis
NEM has been recovering from an extended bear streak since the new Foundation started restructuring project’s operations. Nevertheless, giving the previous failures of the project, the success of the new team is not guaranteed and there is a risk of potential sell off if the new team will not be able to deliver on the promises they have made.
NEM / USD Conclusion
NEM is growing increasingly bullish, with both time frames currently showing bullish patterns playing out to the upside.
If the XEM / USD pair can start to stabilize above its 200-day moving average, the cryptocurrency could easily reach the intended targets of the bullish patterns on both time horizons.

NEM (XEM) Rises 6% as the Bulls Push BackAfter a rough start to 2019, the altcoin has moved higher (18%) over the past week.


XEMUSD: Close to our final Target.The 0.0777 Lower Low was made but still the 0.060 mark was defended from last week's sharp sell off. Regardless of this resilience, the 1W Channel Down (RSI = 35.284, MACD = -0.076, Highs/Lows = -0.0092) is still in need of a new Lower Low and that is why we still have one TP left at 0.060. This point will complete our long term shorting sequence on XEMUSD (unless the monthly SMA100 = 0.05092 holds, in which case we will book the profit manually). The coin should then consolidate for a 2 - 3 month period and establish a support. We will update when the support base gives a new pattern.
** If you like our free content follow our profile (www.tradingview.com) to get more daily ideas. **
Comments and likes are greatly appreciated.

NEM (XEM) re-listed on Coincheck exchange____ Click "Like" to help NEM rise ) ____
NEM is a dual-layer blockchain similar to Ethereum but written in Java, that is one of the most popular computer programming languages. Launched back in 2015, the NEM mainnet supports multiple ledgers on its cryptocurrency layer, and the NEM Smart Assets layer supports mosaics to represent any store of value. NEM’s proprietary crypto coin is XEM, which is harvested (mined) using a Proof-of-Importance algorithm. Its the Smart Asset System that makes NEM so powerful. Nodes on the NEM blockchain process API calls, which makes it easy to develop for, whether the dApp accesses NEM’s API directly, through a server, or in the background. In short, NEM built a blockchain-based cloud platform with a NEM Infrastructure Server (NIS) made of secure, decentralized processing nodes on one side and a client side, like the NEM Community Client (NCC), which acts as a gateway.
Back in January 2018, Coincheck suffered a malicious hack, where thieves managed to steal approximately $520m worth of NEM. It was the most expensive theft on a cryptocurrency exchange as compared to the Mt.Gox theft, $450 were stolen. NEM stopped tracking the coins in mid-March after concluding that enough data was provided to local law enforcement to conduct a full investigation. Coincheck responded to the hack by refunding the 260,000 affected users in JPY from their own capital. Such decision to refund was taken very positively by cryptocurrency community and recently, on the November 12, Coincheck announced the resumption of trading for XEM coins.
Quote of an announcement:
“ resumed new account opening and payment/purchase of some virtual currencies on October 30, 2018,” the exchange announced on their website. “With regard to ETH, XEM, and LSK, technical safety confirmation has been completed with the cooperation of external experts and we have resumed payment/purchase of the virtual currency from November 12, 2018.”
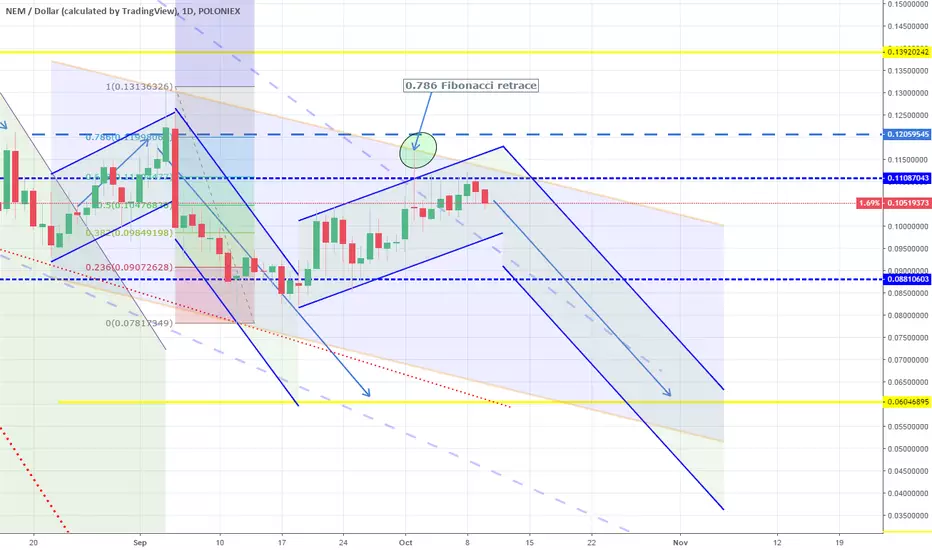
After the re-listing announcement by Coincheck, price went straight up, while NEM gained over 60% against the USD. Price tested the $0.15 high, but then immediately corrected back down. Currently XEM/USD is trading at $0.094, after rejecting the 61.8% Fibonacci support. Although the spike below the support has been produced, it managed to close above. This might suggest the strength of the XEM coin, and as long as support holds, price is likely to increase.
However, considering the collapse of the Bitcoin, NEM also remains in the risk territory. Further decline towards $0.086 Fib support, or even down to $0.08 psychological support is to be expected.


Multiple signals on XEM showing bullish*** THIS IS NOT AN ADVICE, DO YOUR RESEARCH AND TRADE WITH YOUR OWN RESPONSIBILITY***
I have multiple buy signals on NEM, here are the lists.
Volume have been increasing aligns with VROC signaling trend reversal.
Typical rounding bottom on XEMUSD chart which gives a target of 0.8USD or 600% from current price.
On the other hand the XEMBTC chart shows downtrend line broken also signaling bullish.

XEM! Just my two cents!This baby is getting ready to launch! But prepare for trouble! Make it double! Team Rocket isn't blasting off quite yet!
Don't be fooled by the latest pump! It will go lower before it hits the stratosphere! It could go to 2 cents, 1 cent wouldn't surprise me either! Wait for the cryptocurrency meltdown to hit rock bottom, then load up!

Profit on XEM with 1 indicatorBuy Green
Sell Red
//
it's mainly for swing trading, i use the 3 day / 15 day / monthly charts with it and it works perfectly,
//
it works good for stocks and cryptocurrency.
//
you will use heiken ashi chart style and turn on the EMA DOTS indicator.
once the indicator is on you will hide the heiken ashi so you only see the dots.
//
when a green dot -6.68% -7.44% -7.44% appears you buy, if a green dot -6.68% -7.44% -7.44% appears after that green dot -6.68% -7.44% -7.44% you hold your investment.
if a red dot appears you sell your position. easy as that.
//
the standard dots setting will be set to 10 - use this for any chart above 3 days
change the dots setting to 6 for 3day charts and below
//
shorter time frames will be choppy.
//
larger time frames will be smooth.
//
*Daytrading smaller timeframes is possible but not recommended.

XEM massive gains w/ this 1 indicatorBuy Green
Sell Red
it's mainly for swing trading, i use the 3 day / 15 day / monthly charts with it and it works perfectly,
it works good for stocks and cryptocurrency.
you will use heiken ashi chart style and turn on the EMA DOTS indicator.
once the indicator is on you will hide the heiken ashi so you only see the dots.
when a green dot appears you buy, if a green dot appears after that green dot you hold your investment.
if a red dot appears you sell your position. easy as that.
shorter time frames will be choppy.
larger time frames will be smooth.

New Economy Movement will live up to its name!For the time being though, price will go only in one direction - down! 2-3 cents is very likely, you might even get a fire sale for a penny or less!
Back up the truck when you get the chance - this one is headed for the clouds! $10+, maybe higher!
XEMUSD: TP hit. Rejection successful. Channel Down intact. ShortTP = 0.088 hit as the 1D Channel Down (RSI = 37.914, MACD = -0.002, Highs/Lows = -0.0056, B/BP = -0.0102) made a standard technical Lower High rejection, with the price testing the 0.08788 previous Lower Low on the inner Channel. The bearish momentum on 4H is accumulating (Williams = -82.770) and should look for at least a 0.0777 Lower Low. On the long term we are still targeting 0.060.

XEMUSD: Expect a rejection on the 1W Lower High. Short.The price is approaching the Lower High limit of the 1W Channel Down (RSI = 37.875, MACD = -0.079, Highs/Lows = -0.0014, B/BP = -0.0321) and if the 1D candle breaks 0.09500, it is a confirmation of a break out towards the 0.0777 1D support. 0.088 can be your first TP but we are still looking for 0.060 on the long term.
Inverted H&S.Will it finally end this downtrend? This formation (IH&S) is combined with triangle. The moment of bullish attack (and volume) must be precisely watched to decide to get in or not.

XEMUSD: 1D Channel Down intact. Support test ahead.XEMUSD delivered the anticipated bearish leg on 1D giving shape to the new 4H Channel Down that should eventually test the 0.0777 1D support. As seen on the chart, 1D is a clear Channel Down (RSI = 48.355, STOCH = 33.730) but until that support breaks, on low gradient (MACD = -0.001, Highs/Lows = -0.0003). We are still bearish, aiming at 0.060.

I know that i know nothing...so i reenter long here @10.4cent In case of fake bullish move from market side i do not sell this XEMs with loss (XEMs will go to longterm purse). And in case of fake dinamical wave down to 5-6cents is imminent.
Not trading advice!

XEMUSD: Simple Channel Down pattern. Short.NEM is following a Channel Down pattern on 1D with distinct Lower Highs and Lower Lows that has just made its latest Lower High (RSI = 54.758, Highs/Lows = 0.0000). Technically and always according to the underlying selling pressure applied by the 1W bearish trend (MACD = -0.081, Highs/Lows = -0.0056, B/BP = -0.0439), we should see a Lower Low on XEMUSD near 0.074. Our TP remains 0.060 but will reconsider once we approach 0.075 depending on the parameters then.
50% of my entries in alts specified in previous ideas...are closed with hope to retake lower
fake wave down is awaited by me not only in XEMUSD.
