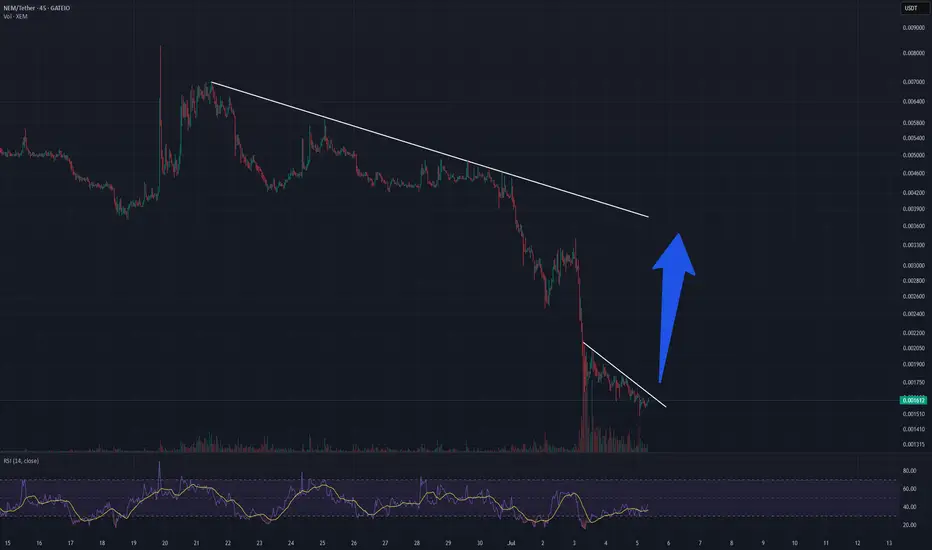
XEM pump past downtrendDelisting from the IObit exchange caused a strong price drop, the project is alive, several wallets have large amounts, someone here will try to pump it strongly and return to 0.0042
Related pairs
Long Entry Signal for XEM/USDT
Based on the daily chart for XEMUSDT on Bybit, here's a concise analysis:
MLR vs. SMA: The MLR (blue) is above the SMA (pink), indicating a bullish trend.
MLR vs. BB Center: The MLR is above the BB Center Line (orange), suggesting bullish momentum.
PSAR: The PSAR dots (black) are under the price,

XEM breakout downtrendlineXEM potensial to be something big gain
already breakout downtrendline
can be breakout or retest first before PUMP
volume increase in past day
buy and hold in this bullseason
sell if invalid bullseason :)

XEM could increase its price between +130% to +230% XEM is looking good to continue climbing up, the higher timeframes suggesting more upside prices, the target is between $0,08515 to $0,12320 the highs from 2022 with monthly and weekly levels, fibonacci levels.
In the end of this week, with a close above $0,03665 will be a positive sign for that hap

Intraday. XEMUSDT.P, 0.0249, LONGThe token looks stronger than the rest of the market. Goes to retest the key level with a large accumulation. At the end of yesterday, the token was bought back, which shows the strength of the buyer in this market. There is emptiness along the way; nothing should interfere with the impulse.

RR=2 Sell ideabearish butterfly pattern + RSI Hidden divergence + breakout of trendline followed by a pullback
: potential reversal scenario
PS never risk more than 2% of your capital per trade

XEMUSDT: Bullish Trend (HHs and HLs)XEMUSDT is moving in uptrend and forming HHs and HLs, there is also bullish divergence on 1D time frame which is stronge confirmation of the bullish trend, mention buying area is the FIB 0.5 area which we will consider new HLs and take a long trade on this point and previous HLs is our SL and new HH

Xemusdt Strong Buy opportunityXemusdt is demonstrating a rounding bottom formation, indicating a potential reversal pattern with the price targeting the immediate resistance level.
We've identified a robust demand zone, which could also serve as a buyback area if the price presents the opportunity.
Additionally, our immediat

XEM looks bullishXEM appears to be inside a large diametric, with the D wave being a triangle.
We now seem to be at the end of wave D and will soon enter bullish wave E.
Wave E of this diametric is a bullish wave.
If the price returns to the green range, we will look for buy/long positions
The targets are clear

NEMUSDT 8H#NEM is moving inside a symmetrical triangle. Currently, it is rejected from the triangle resistance and MA100 on the 8H timeframe. It is facing MA50 now. Wait for a clean breakout and then enter to this coin. Targets are:
$0.04130
$0.04397
$0.04777
$0.05261
Supports are:
$0.03709
$0.03534
$0.03000

See all ideas
Summarizing what the indicators are suggesting.
Oscillators
Neutral
SellBuy
Strong sellStrong buy
Strong sellSellNeutralBuyStrong buy
Oscillators
Neutral
SellBuy
Strong sellStrong buy
Strong sellSellNeutralBuyStrong buy
Summary
Neutral
SellBuy
Strong sellStrong buy
Strong sellSellNeutralBuyStrong buy
Summary
Neutral
SellBuy
Strong sellStrong buy
Strong sellSellNeutralBuyStrong buy
Summary
Neutral
SellBuy
Strong sellStrong buy
Strong sellSellNeutralBuyStrong buy
Moving Averages
Neutral
SellBuy
Strong sellStrong buy
Strong sellSellNeutralBuyStrong buy
Moving Averages
Neutral
SellBuy
Strong sellStrong buy
Strong sellSellNeutralBuyStrong buy
Displays a symbol's price movements over previous years to identify recurring trends.
Curated watchlists where XEMUSDT is featured.

Alt forks: The path less traveled. But still pretty profitable
12 No. of Symbols
See all sparks
Frequently Asked Questions
The current price of XEMUSDT SPOT (XEM) is 0.00239 USDT — it has fallen −7.00% in the past 24 hours. Try placing this info into the context by checking out what coins are also gaining and losing at the moment and seeing XEM price chart.
XEMUSDT SPOT price has fallen by −26.91% over the last week, its month performance shows a −21.90% decrease, and as for the last year, XEMUSDT SPOT has decreased by −90.08%. See more dynamics on XEM price chart.
Keep track of coins' changes with our Crypto Coins Heatmap.
Keep track of coins' changes with our Crypto Coins Heatmap.
XEMUSDT SPOT (XEM) reached its highest price on Nov 30, 2021 — it amounted to 0.17735 USDT. Find more insights on the XEM price chart.
See the list of crypto gainers and choose what best fits your strategy.
See the list of crypto gainers and choose what best fits your strategy.
XEMUSDT SPOT (XEM) reached the lowest price of 0.00151 USDT on Jul 5, 2025. View more XEMUSDT SPOT dynamics on the price chart.
See the list of crypto losers to find unexpected opportunities.
See the list of crypto losers to find unexpected opportunities.
The safest choice when buying XEM is to go to a well-known crypto exchange. Some of the popular names are Binance, Coinbase, Kraken. But you'll have to find a reliable broker and create an account first. You can trade XEM right from TradingView charts — just choose a broker and connect to your account.
Crypto markets are famous for their volatility, so one should study all the available stats before adding crypto assets to their portfolio. Very often it's technical analysis that comes in handy. We prepared technical ratings for XEMUSDT SPOT (XEM): today its technical analysis shows the sell signal, and according to the 1 week rating XEM shows the sell signal. And you'd better dig deeper and study 1 month rating too — it's sell. Find inspiration in XEMUSDT SPOT trading ideas and keep track of what's moving crypto markets with our crypto news feed.
XEMUSDT SPOT (XEM) is just as reliable as any other crypto asset — this corner of the world market is highly volatile. Today, for instance, XEMUSDT SPOT is estimated as 13.30% volatile. The only thing it means is that you must prepare and examine all available information before making a decision. And if you're not sure about XEMUSDT SPOT, you can find more inspiration in our curated watchlists.
You can discuss XEMUSDT SPOT (XEM) with other users in our public chats, Minds or in the comments to Ideas.