XEMUSDT trade ideas

XEMUSDT:#XEM I think it's very close to bottom here,
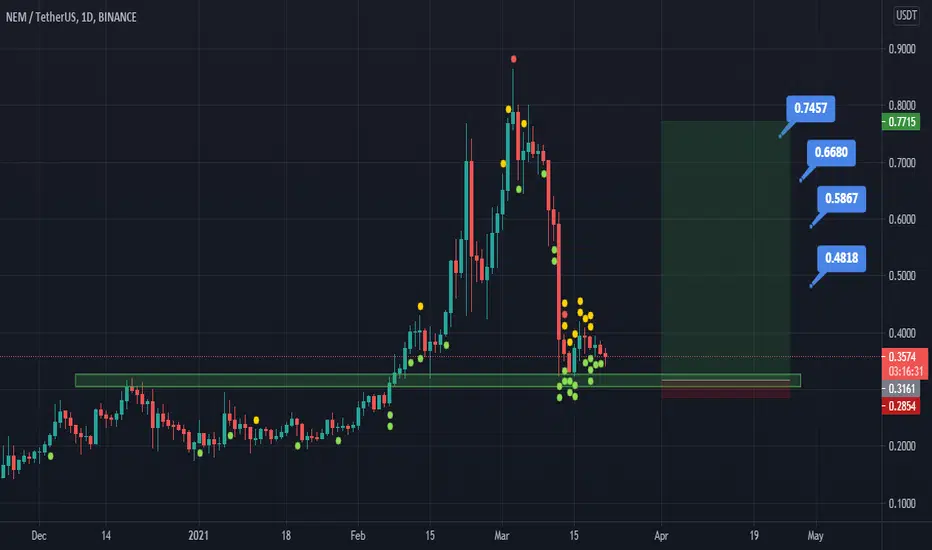
#XEM/USDT (SPOT BUY)
Entry 1 - 0.34 CMP (20%)
Entry 2 - 0.31 (40%)
Entry 3 - 0.28 (40%)
🎯 Targets - 0.37 - 0.395- 0.425
HODL Targets:- 0.50 - 0.65 - 1
Stop loss - 0.265
@Tbae_Nike
————————————
DISCLAIMER:
_TbaeTrades:
Your investments are your responsibility
I do not accept any liability for any loss or damage which is incurred from you acting or not acting as a result of reading any of my publications. You acknowledge that if you use the information I provide, you're at your own risk. i do not offer investment advice and nothing in the calls that is or tobe published, should be construed as investment advice.
_#TBAE

XEMUSDT 20%-110% ProfitXem Long
tight sl
3 targets
you can buy at any price but im buy it at 0.3300
be careful with those leverages! Don't go any further than x5 on any assets or any situations ,i recommend x3


XEM looks deadXEM seems to be dead right now going sideways in a silent way but dont think it will go any lower.

XEM TargetHello all, enter when XEM sustains, at least, a 4hr candle close above $0.4 with a target of $0.6458. Stop loss $0.32, or where you fell comfortable.
Cheers!


XEM/USDT Risky LongBare in mind this is a risky trade as NEM has been copping quite a bit of flak recently.
Apart from that, its actually looking like quite a good trade. Currently sitting on a very long uptrend.
Also sitting nicely on support, with hard support not to far down below. Starting to see a restricting pattern of price action.
Hoping to see a bounce to previous highs which will be roughly a 10-20% trade.

An old favorite coin, just looking at stuff at 5am theres nothing to stop it from doing this. but its more of a hypothesis than an actual goal.... i may buy some just for the small jump

NEM (XEM) - March 24Hello?
Dear traders, nice to meet you.
By "following" you can always get new information quickly.
Please also click "Like".
Have a good day.
-------------------------------------------------- -----
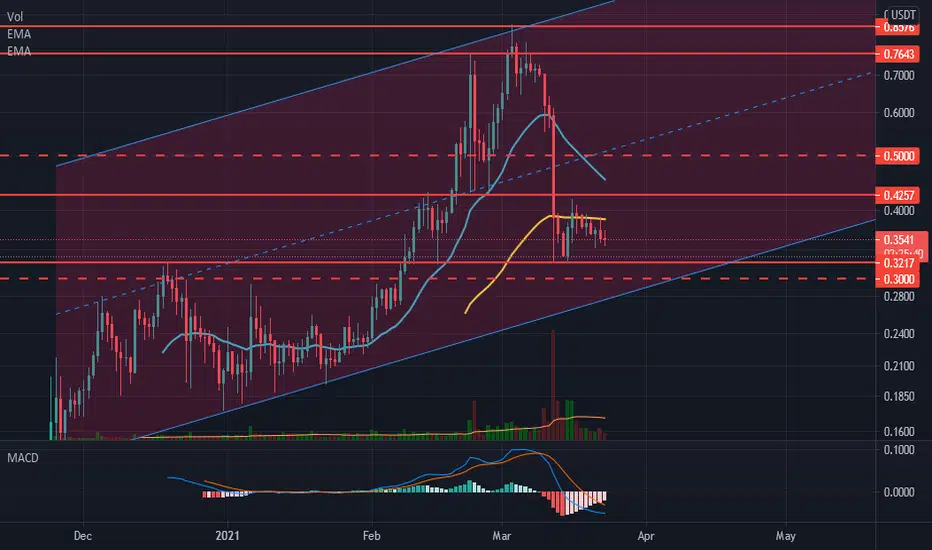
We'll have to see if we can get support from the 0.3291-0.3619 segment and climb to the 0.4078-0.4471 segment.
In particular, you need to rise along the uptrend line to see if it breaks off the downtrend line.
If it falls from the 0.3291 point, a Stop Loss is required to preserve profit and loss.
However, careful trading is necessary as it may rise along the uptrend line passing through the 0.2503-0.3291 range.
In order to turn into a short-term uptrend, it must rise to at least 0.4078-0.4471 to gain support.
-------------------------------------
(XEMBTC 1D chart)
We must see if we can get support from the 649 Satoshi-733 Satoshi section and ascend to the 902 Satoshi point.
-------------------------------------------------- -------------------------------------------
** All indicators are lagging indicators.
So, it's important to be aware that the indicator moves accordingly with the movement of price and volume.
Just for the sake of convenience, we are talking upside down for interpretation of the indicators.
** The wRSI_SR indicator is an indicator created by adding settings and options from the existing Stochastic RSI indicator.
Therefore, the interpretation is the same as the conventional stochastic RSI indicator. (K, D line -> R, S line)
** The OBV indicator was re-created by applying a formula to the DepthHouse Trading indicator, an indicator that oh92 disclosed. (Thank you for this.)
** Check support, resistance, and abbreviation points.
** Support or resistance is based on the closing price of the 1D chart.
** All explanations are for reference only and do not guarantee profit or loss on investment.
Explanation of abbreviations displayed on the chart
R: A point or section of resistance that requires a response to preserve profits
S-L: Stop Loss point or section
S: A point or segment that can be bought for profit generation as a support point or segment
(Short-term Stop Loss can be said to be a point where profits and losses can be preserved or additionally entered through installment transactions. It is a short-term investment perspective.)
GAP refers to the difference in prices that occurred when the stock market, CME, and BAKKT exchanges were closed because they do not trade 24 hours a day.
G1: Closing price when closed
G2: Cigar at the time of opening
(Example) Gap (G1-G2)


XEM vs USD & XEM vs BTC 🔥Hello! Pay attention on NEM!
Have great view after making good profits😉
Take this opportunity to buy that cool dip! 🔥
Stay with Rocket Bomb 🚀💣


MOVEZ major crypto movers consecutive time frame of when and how much each major crypto asset started their bullrun move - for case of a crash or huge dip

After the final correction, we start flying. Profit: %90-100After the final correction, we start flying. Profit: %90-100. Bol şans friends.

MOVES how major movers took off consecutivelyfor buying the crash / estimating which coins will move first and capitalize investment so you can reinvest it in still dormant ones.