XEMUSDT trade ideas

$XEM Reversal from here or more blood drag by Bitcoin?I'm mainly buying $XEM only for the Airdrop. So the dips are much appreciated you STINKY BEARS.


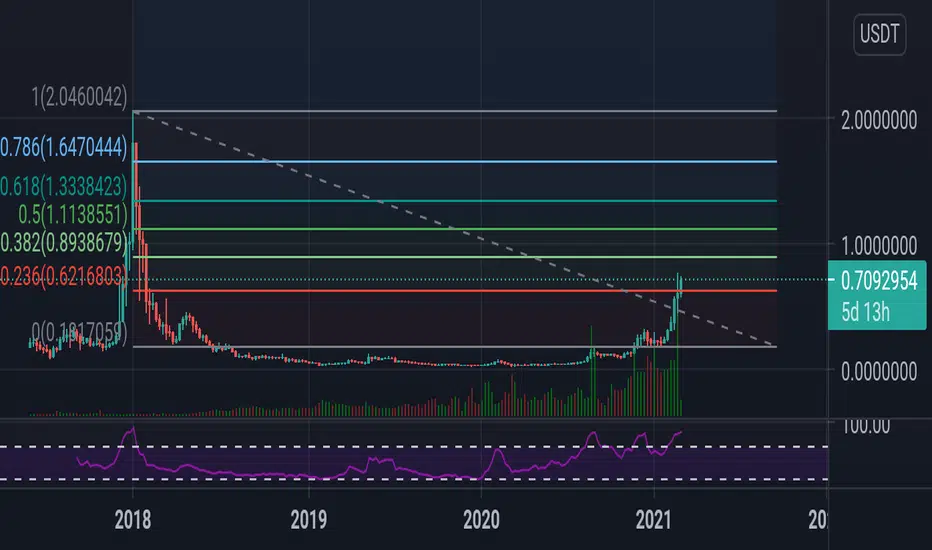
🆓NEM/USDT Analysis (4/3) #XEM $XEMXEM has risen a lot and the selling force appeared at 0.8$ zone. So I think it will have a big correction to 0.6$ zone or even 0.5$ zone, these zones are quite good to start accumulating for a new rally! I think XEM will pump strongly at late March
📅NEWS
👉Feb 28 : Symbol Snapshot & Launch
👉Mar 15 : Symbol Mainnet Launch
👉Mar 15 : StXYM for StXEM Holders
📈BUY
-Buy: 0.585-0.615$. SL if B
-Buy: 0.49-0.51$. SL if B
📉SELL
-Sell: 0.78-0.82$. SL if A
-Sell: 1.1-1.15$. SL if A
♻️BACK-UP
-Buy: 0.78-0.82$ if A. SL if B
❓Details
Condition A : "If 1D candle closes ABOVE this zone"
Condition B : "If 1D candle closes BELOW this zone"

NEM (XEM) - March 4Hello?
Dear traders, nice to meet you.
"Like" is a huge force for me.
By "following" you can always get new information quickly.
Thank you for always supporting me.
-------------------------------------------------- -----
You should watch for any movement that deviates from the 0.7226-0.8801 range.
In particular, it remains to be seen if it can rise above the 0.8014 point.
If it falls, we need to see if it is supported in the 0.6833-0.7226 range.
If you go down at 0.5652, you need a short stop loss.
If it falls, you have to think about how you will react in the 0.5652-0.6833 range.
The next volatility period is around March 10th.
-------------------------------------------------- -------------------------------------------
** All indicators are lagging indicators.
So, it's important to be aware that the indicator moves accordingly with the movement of price and volume.
Just for convenience, we are talking upside down for interpretation of the indicators.
** The wRSI_SR indicator is an indicator created by adding settings and options from the existing Stochastic RSI indicator.
Hence, the interpretation is the same as the traditional Stochastic RSI indicator. (K, D line -> R, S line)
** The OBV indicator was re-created by applying a formula to the DepthHouse Trading indicator, an indicator that oh92 disclosed. (Thank you for this.)
** Check support, resistance, and abbreviation points.
** Support or resistance is based on the closing price of the 1D chart.
** All explanations are for reference only and do not guarantee profit or loss on investment.
Explanation of abbreviations displayed on the chart
R: A point or section of resistance that requires a response to preserve profits
S-L: Stop Loss point or section
S: A point or segment that can be bought for profit generation as a support point or segment
(Short-term Stop Loss can be said to be a point where profits and losses can be preserved or additionally entered through installment transactions. It is a short-term investment perspective.)
GAP refers to the difference in prices that occurred when the stock market, CME, and BAKKT exchanges were closed because they do not trade 24 hours a day.
G1: Closing price when closed
G2: Cigar at the time of opening
(Example) Gap (G1-G2)

XEMUSDT shortRisk warning, disclaimer: the above is a personal market judgment based on published information and historical chart data on Tradingview, all analysis is only subjective. Hope investors consider, I am not responsible for your investment decision. Thank you.
Good luck!


XEMUSDT needs some correction!XEMUSDT needs some correction up to 0.66$ and after that 0.90$ and 1$ are next targets


XEMUSDT SHORT!XEM has been pumping for several days now and it is currently OVERBOUGHT.
- Not financial Advice

XEM/USDT ready to dip and bounce off BBXEM touched the top of the BB and is ready to go to the bottom.


XEMUSDTHello to you all. Mars Signals team wishes you high profits at all times.
The price is moving inside a bullish channel. According to the news around this cryptocurrency, it is expected for the price to go up. In this scenario, it will break the upper line of the channel and will move toward its resistances.
But, if the situation changes, the price will move down the channel and toward its supports.
This cryptocurrency would be good for long term investment.
Warning: This is just a suggestion to you and we do not guarantee profits.
Wish you luck!

NEM (XEM) 5.5 Billion Market Cap and you sit there!Salve
Nem XEM Hmm! they are five years in crypto game and early investors are 712068% in profit now, cool ha?
NEM is a highly versatile crypto solution which seeks to adhere to a host of mainstream industry requirements. It is written in Java and JavaScript with 100% original source code. NEM has a stated goal of a wide distribution model and has introduced new features in blockchain technology in its proof-of-importance algorithm. NEM also features an integrated P2P secure and encrypted messaging system, multisignature accounts and an Eigentrust++ reputation system....
tg: 0.6--0.7---0.9---1-----1.5-----2
and watch my out fib lines
Ciao

Consider filling your bag with XEMHello everyone,
After long accumulation, XEM is currently in an uptrend.
The ascending trend support line is holding.
MA cross is bullish
Buy now or buy within rotated rectangle
Sell target is also shown in the chart
Trade safe!
Sixtus Global


XEMUSDT will try another push?After a false breakout due to BTC correction, will XEM try another push?
Will trade the breakout if happend.

God bless triangles!One more triangle, wolves🔥
Symmetrical triangle on small frame on XEMUSDT.
According to Elliott Waves theory all the waves are done and now the price is heading to breakout.
There was a strong bearish sentiment before.
Follow the chart and look for the breakout.
If you enjoy my FREE Technical Analysis , support the idea with a big LIKE👍 and don't forget to SUBSCRIBE my channel, you won't miss anything!
Feel free to leave comments✉️
And always remember: "we don't predict, we react".

XEM 100% short termdue to upcoming fundamental news and obvious breakout and retest there is potential 2X for this coin in short term
