XEM - NEM THE EXPECTING BEAKOUT COULD ENTER ANY TIME!Hello trading friends,
NEM is an interesting coin for those who won't hold it, and same time don't expect a fast price increase as the market is going on its way. this means not that NEM will get a huge breakout into huge time.
What is more interesting to this coin is that it shows a healthy pattern of an increasing trend, and when this will happen, the market will show.
As we did say before it's interesting to buy at this coin depending on price action, for example, if the Price of NEM breakdown more, it's interesting to add a part, but same time manage your risk and never enter with all you have.
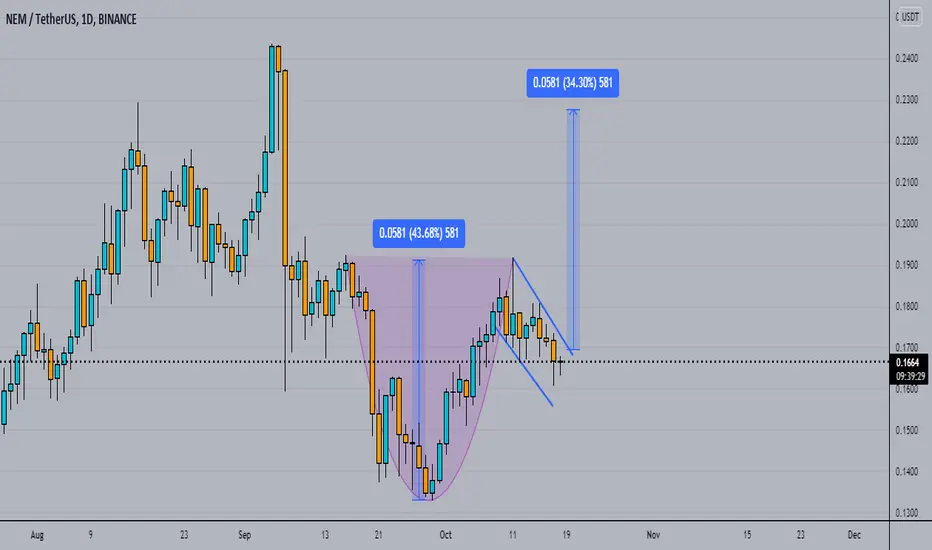
# In the chart you see target 4, but it means target 3.
✅NEM could hit the golden target of 0,30+ in the long term - same time a breakout is possible.
Sharing this idea from trader to trader, so that you will look better to it, and to see or you find it also interesting.
Wish you a great day!
XEMUSDT trade ideas

nem/usdTesting/tracking elliot wave theory. Please do not trade off idea without S/L. Not financial advice.

NEM - XEM THE TOP 3 TARGETS FOR UPTREND 0.32 Is golden one!Hello trading friends,
NEM - XEM shows still an interesting and good trend for an uptrend.
✅NEM (XEM) is still interesting as its long-term coin - at this moment it's into uptrend target, only after hitting 0,164 with the time frame it could enter into scalping breakdown trend for a time. but in the long term its still interesting. In Case it return back - the next 4 breakdown points are interesting targets 0.172 0.166- 0.162- 0.150 # Uptrend golden target could be 0.196- 0.243- 0.323
# The chart trend shows that these coins are interesting, It means now that the coins should show the increase in the short term, as it can take also some time before we can see this increase. but unexpected increases are always possible.
To follow this coin check the last news on Twitter and on YPN platforms.
Manage always your risk as it will stay crypto, and buy not on 1 price action, but on more targets so as to manage the risk well
Most coins do not go directly to the target but take a TA way to it. - This is also not a scalp trade, but a hold trade.
have a great day!


bull flagSafe entry is marked on the chart after the pattern ceiling and targets are broken. Exit according to your risk. The stop is marked below the trend

XEM/USDT Supper bullish 300% Potential from here$XEM/USDT TA Update:
$XEM forming Inverted H&S Pattern.
So Looking Bullish as Per Chart.
I am expecting 300% Potential from here.
Entry:- $0.176-$0.178
Targets:- $0.40/$0.60/$0.80
Stop Loss:- $0.159
Support:- $0.160
Resistance:- $0.40/$0.80
Please click like button and Appreciate my hard work.
Must follow me for latest crypto real time updates.
Thank you.

XEMUSDT - 2 timing for entry in a flag!BYBIT:XEMUSDT
1H trend chart
-
XEM is building a big bull flag.
In this flag, a short-term downtrend line(the red one) is resisting price.
If price can take the red line out , it's an aggressive entry timing( with high risk )
Better and safer timing to open position will come when the upper down trend line is broken out .
Both entry get same targets, trading strategy as below.
-
Profit Targets:
a) 0.1915----Fib(1)
b) 0.2074~0.2138---Fib(1.272~1.382)
c) 0.2207-----Fib(1.618)
Stop losses:
a) Depend on the point of break-out
-
If you like this analysis, smash the "like button" and leave a comment below to share your thoughts
or let me know what crypto you want to see!
Trading is a reflection of yourself. Learn more daily and be ready for every opportunity.
Have a nice trading

#XEMUSDT XEM#XEMUSDT @XEMUSDT
Here We Expecting Very Different This long Trade is Temporary This Technical Analysis With Previous All Time High
Keep In Mind.
🟣 Purple Structure
Monthly Structure.
🔴 Red Structure
Weekly Structure.
🔵 Blue Structure
Daily Structure.
🟡 Yellow Structure
4H Structure.
⚪️ Whaite Structure
1H Structure.

XEM usdt buy nowXEM coin
buy now
follow me to see more ideas
watch previous ideas and check accuracy of my strategy.

XEM flag is Waiting for the Breakout soon to the Moon XEM flag is Waiting for the Breakout soon to the Moon


🆓NEM (XEM) Oct-13 #XEM $XEMXEM has good support at 0.17$ zone, it could move towards 0.2$, 0.23$ and 0.3$ zones in this October and November. But if it loses this 0.17$ zone, it will fall down to 0.15$ zone
📈RED PLAN
♻️Condition : If 1-Day closes ABOVE 0.17$ zone
🔴Buy : 0.17
🔴Sell : 0.2 - 0.23 - 0.3
📉BLUE PLAN
♻️Condition : If 1-Day closes BELOW 0.17$ zone
🔵Sell : 0.17
🔵Buy : 0.15
❓Details
🚫Stoploss for Long : 10%
🚫Stoploss for Short : 5%
📈Red Arrow : Main Direction as RED PLAN
📉Blue Arrow : Back-Up Direction as BLUE PLAN
🟩Green zone : Support zone as BUY section
🟥Red zone : Resistance zone as SELL section
🅰️A : The Close price of 1-day candlestick is Above the zone
🅱️B : The Close price of 1-day candlestick is Below the zone


NEM - XEM 📈Education content - When a coin starts to increase?Hello trading friends,
📈This update is an Education update, where we use the example chart OF NEM - XEM.
The known ways and most used ways to see an increasing coins trend are that a coin should show some movement before data, the reason that investors not entering coins is that there is no price action, and price action movement is which makes investors entering.
✅The second way of seeing an increasing trend is that a coin should hit the last trend lines with confirmation and time frame, also if a coin shows unexpected volume what not did shows before, then we should confirm or this confirmation is real or not, in case this volume is real trend volume, then it means a coin has a new interest trend. ( the confirmation of trend can be done with time frame) we did explain before the effect of time frame.
Extra reaso n
The price action gains new levels, and for this reason, it makes it interesting for a coin to hit new high price actions.
📈The above trends are the basic trends with more others that we did not add and which used manny in trading rooms. but there are also advanced ways, which a small part of traders only use it. and here below we will add some of these advanced ways.
✅One of the ways that advanced users use is to study the trend more deep into the moving trends of a coin when it following BTC and when not -
If a coin stays strong into the uptrend also when BTC stays stable and breakdown then is this the first scan to follow the coin more. another advanced way is to follow the whale data of the coin to see or there are new DCA investors that invest at same data trend or any trend into whale data that could make this coin interesting. further, it's important to see the target you expect or this has feasibility and you should depend this on good reasons. there should be more positive reasons for the increasing trend.
How many users going into the hype, and when a coin breakdown they end with a red balance account, the reason of this, that in every coin there are always recovery trends short term or long term, and in this way use good risk management,
The same study we did use for NEM, and NEM shows an interesting trend to increase coming time
see here below the NEM chart trend.
Have a great day!

[Update] Big opportunity for XEM of a bullish movement DailyHello traders, XEM / USDT is in a surge with a return of buying volume traded.
Strong propability to breakout the resistance zone with an increase followed by correction in order to pass the breakout zone.
Wait for signal confirmation on low resistance.
This is not an investment but a recommendation for use
Thank you for taking the time to read my analysis.
I hope you enjoyed.
Good luck in your transactions, stay in your investor memory.
If you like my posts, mash the Like button👍
Please FOLLOW, thank you!

XEM - NEM SHOWS INTERESTING TRENDS WITH 3 targetsHello trading friends,
✅I hope you had a great time with the last increase in trends of BTC.
NEM shows at long term an interesting trend for possible re-entry increase to next targets.
📈Targets
0,195
0,254
0,30+
As always it will stay crypto and manage your risk well, we expecting depending on trends and data that NEM can show a good increase trend coming time, we have seen before also at the same price action levels where NEM did show the same.
✅Like and subscribe to not miss a new idea!✅ Thank you
Manage always your risk, nobody knows the future - all depending on Data, trends, and whale effect
All our charts are not advice and you are responsible for your own investment
🎬To stay updated check always our last update.
Have a great day

$XEM NEM's other forgotten coin could be ready for a move up1DAY BUY signal for $XEM. Not a fan of this project but I won't say no to any money. I'll be watching closely.

Xem Usdt Chart Analysis #XEM USDT 4H Chart SIGNAL by CryptolernersBD
If 4H Candle Successfully Close Above $0.175
Stop-Loss ❌ If 4H Candle Close Below $0.16

XEMUSDT is testing the weekly resistance 🦐XEMUSDT is testing the weekly resistance. IF the price is going to have a breakout, and flip the weekly resistance into new support, According to Plancton's strategy (check our Academy), we can set a nice order
–––––
Follow the Shrimp 🦐
Keep in mind.
🟣 Purple structure -> Monthly structure.
🔴 Red structure -> Weekly structure.
🔵 Blue structure -> Daily structure.
🟡 Yellow structure -> 4h structure.
⚫️ Black structure -> <4h structure.
Here is the Plancton0618 technical analysis, please comment below if you have any question.
The ENTRY in the market will be taken only if the condition of the Plancton0618 strategy will trigger.

Xem Usdt Chart AnalysisXEM USDT 4H Chart
If 4H Candle Successfully Close Above $0.176
Stop-Loss ❌ If 4H Candle Close Below $0.165


