XEMUSDT 23.9.2021 Ready to goAfter completing correction, XEM create 12345 and have small correction.
We expect XEM BULL comback, if price can go up pass 0.193, higher price 0.53 is expected.
XEMUSDT trade ideas


XEMUSDT - [rediction if can break hard resistance aty about 2.0Look to Enter
0.1774
0.1703
Levles Of Support
0.1524
0.1365
0.1166
Resitsance levels
0.1910
0.2041
Take Prtofits
0.2673
0.3501
0.5143
0.8381

XEMUsdt Update (good Position for buy)this is coin for 1 ecosystme for smartcontrct and rdy for move up
little need got money adn after that can big move
It can make you rich
With a good rating, it can go up after moving Fatum, it just needs to attract some money, and in Altsizen :D , it will definitely have strong pumps
The powerful resistance chart that is on the way is specified
If you shrink the chart and see the bigger picture in daily or weekly timeframes, you can see a large cup that can grow big if it happens.
Good luck
EntryPoint :
0.1774
0.1703
Supports:
0.1524
0.1365
0.1166
Resistance:
0.1910
0.2041
Targets:
0.2673
0.3501
0.5143
0.8381
For mid time Targets:
1.5620 >> Good Target
2.1590
3.4412
GL
Remember : This analysis tries to identify more precise goals for the medium and long term, and more support is selected to have more entry points in the event of a fall.


XEM market updatemajor descending channel is shown in the chart, it has too much work to grow up safely :(

Xem Super LongBased on dynamic resistance and this currency has the ability to grow because it lags behind the market. But this plan may not happen. But if they reject the dynamic resistance that I have identified, it will be 100% continuing its behavior along the same line of resistance.

XEM, GOING TO THE MOON (*_*)XEM plunged by 20.2% over the last 24 hours and was priced at $0.186. The coin recently broke below its almost month long-standing support line of $0.184. With a further bearish push, the altcoin will trade near the $0.159 price line. The token hasn’t traded below the aforementioned support line in over a month’s time.
The best entry point is after retesting the 0.2285
Good luck.

XemUsdt Updatethis like few coin late move but can going up slowly but can do
Vet move vechain move this can pump
GL
Supports:
0.1895 >>> Entry Point
0.1815
0.1570
0.1398
0.1243
Resistance:
0.2290
Targets:
0.2995
0.4217
0.6515
0.8177
1.1331
For HODL:
2.0862
GL

Bullish divergence in XEMUSDT* XEMUSDT is in uptrend with respecting the below trend-line as it's support.
* Currently the price is trading between the upper trend-line as resistance and it's support zone around $0.185 forming a Descending triangle.
* RSI indicator also forms bullish divergence , divergence occurs when there is no longer the same momentum between the price and RSI indicator.
* In order to continue the bull run the price needs to breaks the above resistance.

🔥 XEM Break Out From ConsolidationLike many other tokens, XEM has been lagging the market recently. However, it managed to break out of the horizontal pattern today, potentially marking the way for a move like we saw late July / early August.
Main target for the new move is $0.30, which I'm expecting that XEM will reach within the next couple of weeks. XEM is lagging the market, so it could go very quickly.
Happy trading!

XEMUSDT🌟this alt still moving in a descending channel but the movements are getting lower and lower so that could mean a turn back in bias for this alt and we are getting the advantage of leaving a sideway from its movements in its resistances directions
👉This idea has the confirmation of "advanced price action" 👍
👉Follow us and invite your friends too, this way we can share ideas and signal to anyone we care 👍
👉Hit share and spread the information in public chats or your twitter for everybody to get profit 👍
👉Tell us what's important for you in the market or what asset makes a difference in your investment basket 👍

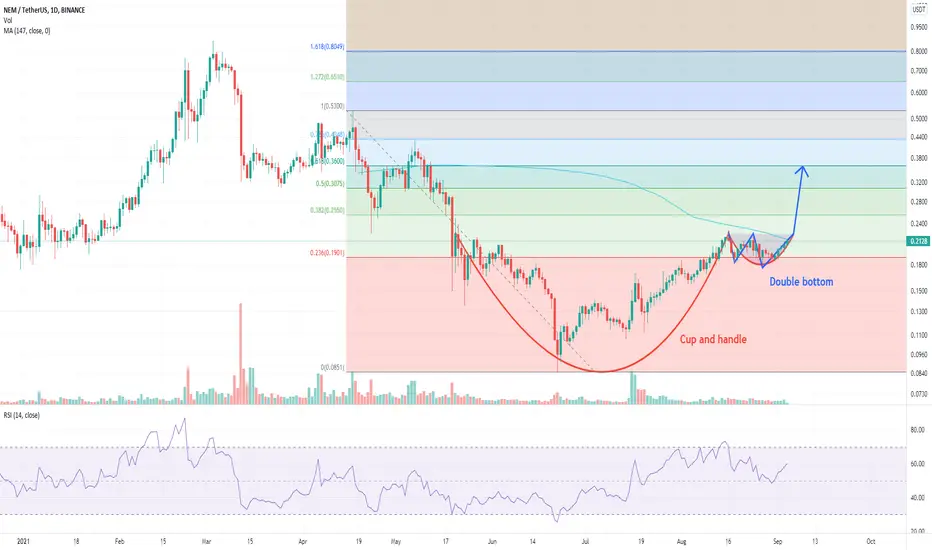
XEMUSDT LONG* MACD crossing positive soon on the daily.
* Double bottom forming
* Can the double bottom complete the handle of the cup & handle and pump XEMUSDT to 0.36$?
Ready for pullback?The following trendline was broken in the past hours, but it seems the coin is about to make a pullback which will more likely to finish on 0.618 fib from the last run, best to open position on a round number like 0.2010 or 0.2000
Have nice day, good luck

Long 🟢 Bullish Wedge on XEMAI sees a wedge pattern on XEM chart.
Quant computers show a high probability bullish scenario.
On a breakout, we open long until the orange box.

XEM USDTXEM USDT
wait to breakout trend line after retest of trend line buy it
TARGET 0.26.75
STOP 0.16.75

XEM Is About To Explode!XEM looks bullish for Long-Term holding!
All targets have been marked.
Patience is the key.

accumulation zonetry to accumulate on 1851 for short term profit 5-6%
having good support in this area


XEM USDT CURRENTLY CONSOLIDATING and facing resistance upward once breaks targets are mentioned
IF DAILY CLOUSER IS ABOVE 0.221 VERY BULLISH

xemusdtxemusdt i guess this could go very bullish soon
yup yup yup yup yup yup yup yup yup yup yup yup

