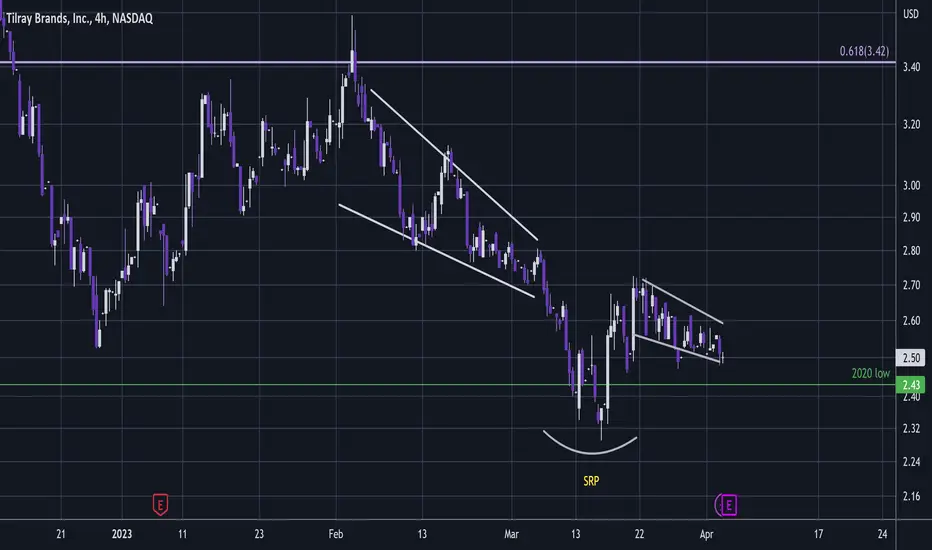
TLRY - Earnings Pop ?I've seen this pattern a few times recently.
Here it is not exactly the same but there is a steep then shallow descending channel separated by a dump that led to a pump.
TLRY dump fell below the major 2020 low and so this is a significant area for a SRP shakeout reversal pattern.
Now that the liquidity is tapped below the low, TLRY may be ready for a pop or who knows maybe even a very large pop.
Earnings coming up can bring volatility and if its good news then perhaps a big bounce will be coming.
This is a trade that will need a little luck but its worth a punt.
If it doesn't pop I still think this is a good area for a long term hold at the 3 year low.
Not advice.
2HQ trade ideas
TRLY Undervalued / Fed Fix Long SetupThe 2H chart on TLRY shows a volume profile showing the highest concentration of shares
traded at $2.65 or about 15% above the current price. Short sellers dominated there. Price has
descended down onto the support/demand zone. It is near to tow standard deviations below
the mean VWAP and so very undervalued.
Federal legislation intended to remedy the cannabis industry's issues with banking, commercial
loans and other financial liquidity has begun. This is huge for this subsector and could cause a
breakout from the deep undervalued territory.
I will take a long setup here for a decent amount of shares and hedge with a single
put option for risk management/insurance. ACB is similarly positioned.

Tilray: Wait and See… 😌After initially spurring the downwards movement so commendably from the high of wave (4) in magenta, Tilray has been relaxing in a sidewards movement since December. However, there is yet some work to be done! We expect the share to drop a bit deeper still to finish wave II in gray, whose low should then form the basis for a fresh upwards movement. Wave (1) in magenta should carry the course above the resistance at $5.12 eventually and even the subsequent counter movement should peter out above this mark.

Possibly 10x Money Here in 2023-2024TLRY - Wave 4 is about to take place and I think this will be a sizable uptrend. SPY is breaking upward at the same time. TLRY will feed off of that if I am right.

TILRAY Stock Chart Fibonacci Analysis 030423 1) Find a FIBO Slingshot
2) Check FIBO 61.80% level
3) Entry Point > 2.71/61.80%

Does History Repeat Itself? Weed Giant Tilray Pharmaceuticals is certainly an interesting stock to pay attention to as it hits a key long-term support level of around $2.48 a share. In the past, the stock has shown its ability to have absolutely ridiculous spikes in price.
By dividing the chart's history into time cycles, one can see that there are clear similarities between the movements of prices between 2018 to 2021 and 2021 to 2023. In times 1 and 2 of the cycle, the stock has fallen, and then in part 3 of the cycle, the stock has fallen to and rebounded off a key support level. Finally, in time 4 of the cycle, the stock rebounded off a higher swing low and had an incredible rally of 1434.57% over 140 days. Now the stock is in time 4 of the cycle again, and so if the stock rebounds off a high swing low, it could have another strong rally if history repeats.
Right now, this is a low-conviction trade since the stock could very well fall through support and not repeat history, but since it is near its support level, this trade has a very high potential reward compared to the risk, and I will be trading this with a small portfolio allocation by either waiting for a clear bullish reversal pattern of a higher swing low or by buying at the support level, with a stop loss slightly below the support level.

MORE DOWNSIDE FOR TLRY?Hello Traders!
I wanted to take a look at TLRY, as per psbassin's request.
Thank you for sending this :)
We see TLRY still creating bearish market structure (LL, LH) and moving nicely within a descending price channel.
At its current range, it has been testing its Monthly Level of 2.70 as support but now finding resistance at our POC of 3.18
Each time the monthly is test, it becomes weaker.
So what would I like to see?
I would like to see a break to the downside, grabbing our liquidity from Mar 2020 before considering placing a long position on this chart
If it breaks down further?
We will see if it still respects our descending price channel and enter a long from the bottom of that range.
If you think you've gotten awesome content from my TA, please smash that like (boost) button!
It keeps me motivated to continue hitting the charts for y'all!!
I'd also love to see requests on any chart you'd like me to look at!
So please leave a comment on what Analysis you'd like me to do next! <333333

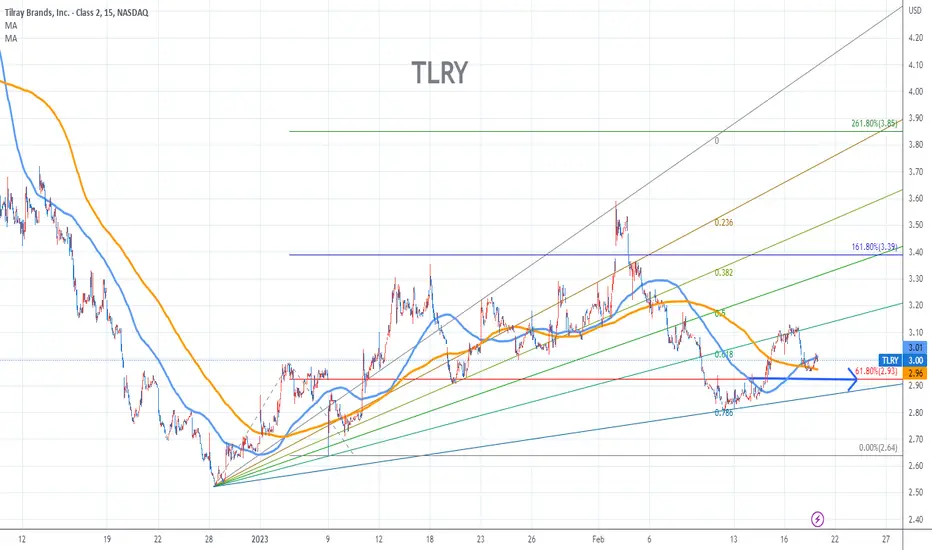
TILRAY Stock Chart Fibonacci Analysis 021923Trading Idea
1) Find a FIBO slingshot
2) Check FIBO 61.80% level
3) Entry Point > 2.93/61.80%
Tilray: Take Root 🌱Tilray has been developing some vibrant saplings, but the share shouldn’t forget to take root. We expect the course to extend below the support at $2.43 to plant wave II in gray. Then, Tilray should sprout upwards again, climbing back above $2.43 and growing further above the resistance at $5.12 as well. There, the course should complete wave (1) in magenta, before wave (2) in magenta should bring it back towards $5.12. However, there’s a 33% chance that wave alt. II could already be potted, which would be confirmed by the stock directly sprawling above the resistance at $5.12.

$TLRYBullish scenario on deck for $TLRY
looks like we about to move upside.
Let see what next week brings…

Short TLRY | Textbook Head and Shoulders formationNo position open yet. Waiting for a breakdown.
The Fed will be announcing another rate hike this week, and in so pushing economy further towards spending cuts.
During high interest rates environment, do you prioritise pot or food costs?

Tilray TLRY Bullish Upside OpportunityTilray Bullish Upside Opportunity
Tilray has broken the falling wedge and since then its ramping up toward it's 1st target close to 5$ USD, 2nd target 7.3 USD.
we can see an uptrend with new higher highs . lately it has broken a Bullish head and shoulder bottom pattern or Symmetrical triangle that tells me the upside continuation is still valid.

TLRY - Smoke But No Fire As Yet 🔥Here's another stock that rekt plenty a punter not realising just how deep trends can go.
I've been saying for a long time TLRY will go DEEP and has now passed my $3.5 target.
I did have a much lower target but I think it may be close to bottoming here.
Plenty of bullish divergence coming in but no excitement in the price as yet so smoke but no fire as yet.
If indexes do break out then I think TLRY will pump hard but if they fall then I will revert back to my deeper target of $0.6.
We'll be looking closely at this one, could be a rocket... 🧑🏻🚀🚀🚀
Not advice.
$TLRY Bullish 3 drivesReal clean 3 drives pattern here on TLRY bullish with bullish divergence on the last 2 lows. Possible setting up the 3 bar play as well. This one has declining volatility at the moment, so it could consolidate a little further before the stronger move comes in. It IS however above the support of the first low and attempting to break local resistance.

HEXO TO 1k!?The 1.618 on a linear scale points @1k
The 2.618 on a log scale points @1.21 wich we reached recently and bounced on.
Would need further confirmations such as daily close over the 8 daily EMA and the 21 Weekly EMA.
AKA My old analysis updated with reverse split price :)

Tilray Could be breaking out at 3.28. Stops below 3.24s Incase fake breakout. This could
Be it for first time to fly! Wish I could say more but at work. I went long 3.28 good luck

🟨 Climax Run - $TLRY exampleI have covered this in my education blog, but here is a great example of a Climax Run Stock
Checklist
✅ Price looks almost vertical
❌ Run occurs after at least 18 weeks of the first base. (This run is 5 weeks after first base)
✅ Rapid advancement +180%
✅ Last 8 days before drop was 7 out of 8 days up
✅ Last 2 trading days we saw the largest trading range
❌ Stock is not extended above 200d MA - since no 200 days of trading (early IPO)
❌ No Stock splits

Tilray Target 4.5Bullish divergence
Nice geometry
Should close weekly bull
Target is 4.5 this quarter
GRI 2023

Tlry earningsTlry will report earnings next week. Support and resistance are shown and can potentially hit $3.32 which is apart of the resistance line and 50 EMA. If it can break above that, we can see this hit around the $4.50 range. If the earnings are bad this can go back down to its support around $2.48-2.34.

TLRY earnings on MondayTLRY Q2 November 2022 earnings are on Monday 1/9/2023 at 7am. Tilray Brands (TLRY) reported a Q1 August 2022 loss of $0.08 per share on revenue of $153.2 million. The consensus estimate was a loss of $0.06 per share on revenue of $155.7 million. Revenue fell 8.8% compared to the same quarter a year ago. The company said it continues to expect Adjusted EBITDA of $70 million to $80 million for the year ending December 31, 2022. I'm posting this as a long because of the higher probability, lower risk, current technical setup entry point. TLRY at $2.75 is near its major support level on the TTCATR(beta) indicator, plus there's a bullish cross setup on piRSI indicator now also. Here's TLRY levels on the 1-day chart:
Q2 November 2022 consensus:
EPS = -$0.05
Revenue = $158.29M
SMA200 = $4.07
SMA20 Triangular Trend Channel ATR(beta):
top = $4.92
R3 = $4.62
R2 = $4.32
R1 = $4.03
pivot = $3.73
S1 = $3.43
S2 = $3.13
S3 = $2.83
bottom = $2.53
Do your own due diligence, your risk is 100% your responsibility. This is for educational and entertainment purposes only. You win some or you learn some. Consider being charitable with some of your profit to help humankind. Good luck and happy trading friends...
*3x lucky 7s of trading*
7pt Trading compass:
Price action, entry/exit
Volume average/direction
Trend, patterns, momentum
Newsworthy current events
Revenue
Earnings
Balance sheet
7 Common mistakes:
+5% portfolio trades, capital risk management
Beware of analyst's motives
Emotions & Opinions
FOMO : bad timing, the market is ruthless, be shrewd
Lack of planning & discipline
Forgetting restraint
Obdurate repetitive errors, no adaptation
7 Important tools:
Trading View app!, Brokerage UI
Accurate indicators & settings
Wide screen monitor/s
Trading log (pencil & graph paper)
Big, organized desk
Reading books, playing chess
Sorted watch-list
Checkout my indicators:
Fibonacci VIP - volume
Fibonacci MA7 - price
pi RSI - trend momentum
BBMC - bollinger bands
TTC - trend channel
AlertiT - notification
tickerTracker - MFI Oscillator
www.tradingview.com

TLRY Tilray Brands One of My TOP Stock Picks for 2023TLRY Tilray Brands is close to the pandemic low on a huge Falling Wedge and a Double Bottom Chart Pattern.
Looking at the TLRY Tilray Brands options chain, I would buy the $3 strike price Calls with
2023-1-20 expiration date for about
$0.16 premium.
TLRY Tilray Brands is One of My TOP Stock Picks for 2023!
Looking forward to read your opinion about it.

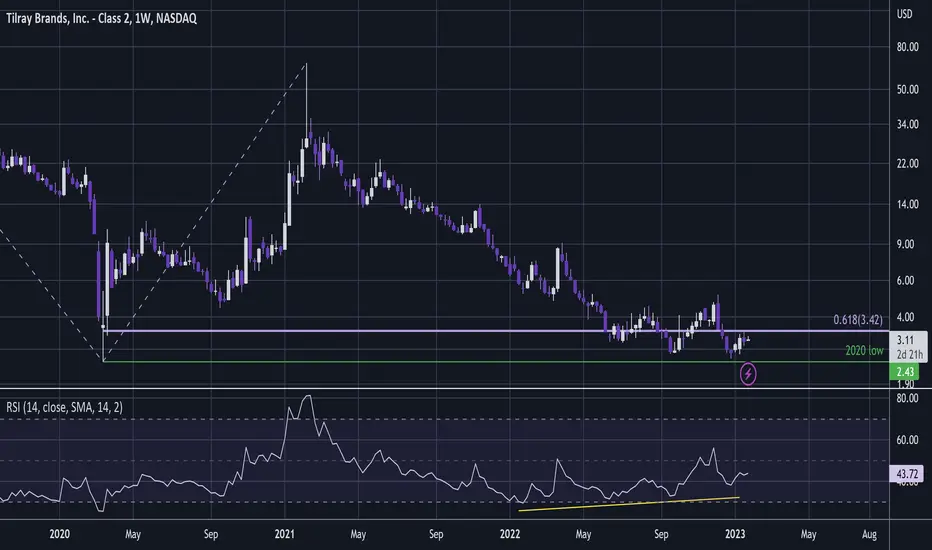
Weed companies are going to zero?TILRAY. Weekly chart.
Fake CHoC and feak breakout. Hope you have an opportunity to SELL it.
After 2.64 you have fib levels on 1.48 and who knows whats next.
We also have large weekly support ar 2.43, so be careful there.
We can touch it and then rebounce until 5.12 which is obviuosly Bullish CHoC.
SUMM:
SHORT — NOW
STOP 5.12
LONG — ONLY IF IT BREAKS 5.12

GANJsterNot much point explaining why
But even u simpletons can see it’s trying to put in a higher low
And I think a monster breakout is coming next year
Could be a face ripping move
…
GRI 2022
Right that’s all your getting out of me
