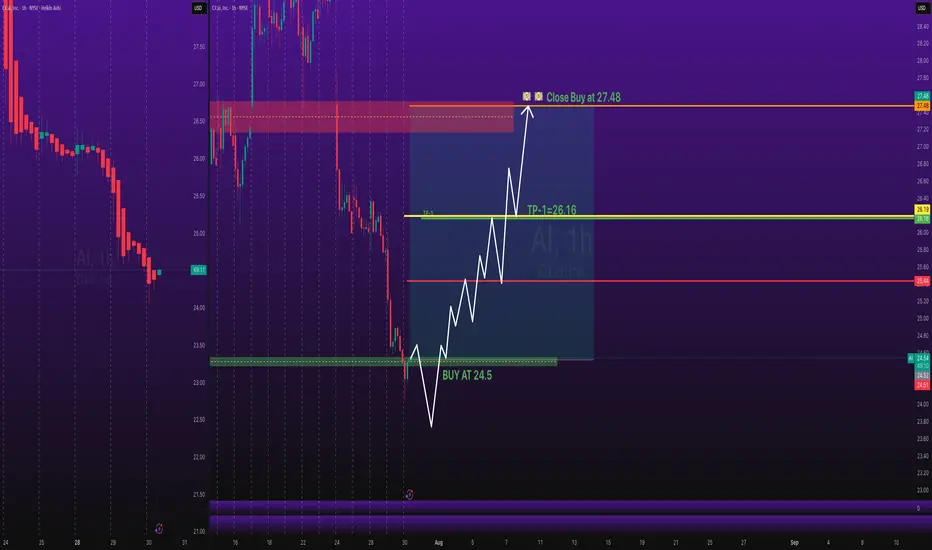
Stocks SPOT ACCOUNT: AI stocks BUT ENTRY with TAKE PROFITStocks SPOT ACCOUNT: NYSE:AI $c3.AI
stocks my buy trade with take profit.
This is my SPOT Accounts for Stocks Portfolio.
Trade shows my Buying and Take Profit Level.
Spot account doesn't need SL because its stocks buying account.
Key facts today
Next report date
—
Report period
—
EPS estimate
—
Revenue estimate
—
−1.970 EUR
−254.92 M EUR
343.53 M EUR
120.86 M
About C3.ai, Inc.
Sector
Industry
CEO
Thomas M. Siebel
Website
Headquarters
Redwood City
Founded
2009
FIGI
BBG00YGDD9D1
C3.ai, Inc. engages in the provision of enterprise artificial intelligence software for digital transformation. It delivers the C3 AI suite for developing, deploying, and operating large-scale AI, predictive analytics, and Internet of Things applications in addition to a portfolio of turn-key AI applications. It operates through the following geographical segments: North America, Europe, The Middle East, and Africa, Asia Pacific, and Rest of World. The company was founded by Thomas M. Siebel, Patricia A. House and Stephen Maurice Ward, Jr. on January 8, 2009 and is headquartered in Redwood City, CA.
Related stocks
AI: Another accummulation swing round before a new journeyAI:
.
Another accummulation swing round before a new journey.
VCP pattern.
Less supply vol at the end of the accumultion range.
.
US STOCKS- WALL STREET DREAM- LET'S THE MARKET SPEAK
$AI they sleep, i eat. Quiet danger..Hello,
Name has been on my watch for a week or so now, finally just sitting back and getting to a multi analytical chart.
To begin: Yes, I see the head and shoulders pattern forming, scary, I know. Aside from that just zoom out, this name has traded in this range for 1,200 days... the range of $2

C3.ai (AI) Shows Signs of Wyckoff AccumulationAI Stock (C3.ai)
C3.ai (Ticker: AI) is currently trading just above key long-term support levels, exhibiting behavior that closely aligns with the Wyckoff Accumulation model. The stock has shown resilience after a prolonged downtrend and is now forming a potential accumulation base near its recent l

Is C3.ai the Quiet Giant of Enterprise AI?C3.ai (AI), an enterprise artificial intelligence software provider, has operated somewhat under the radar despite its foundational role in delivering advanced AI solutions to large organizations. While the broader AI market has seen significant attention on hardware innovators, C3.ai has steadily s

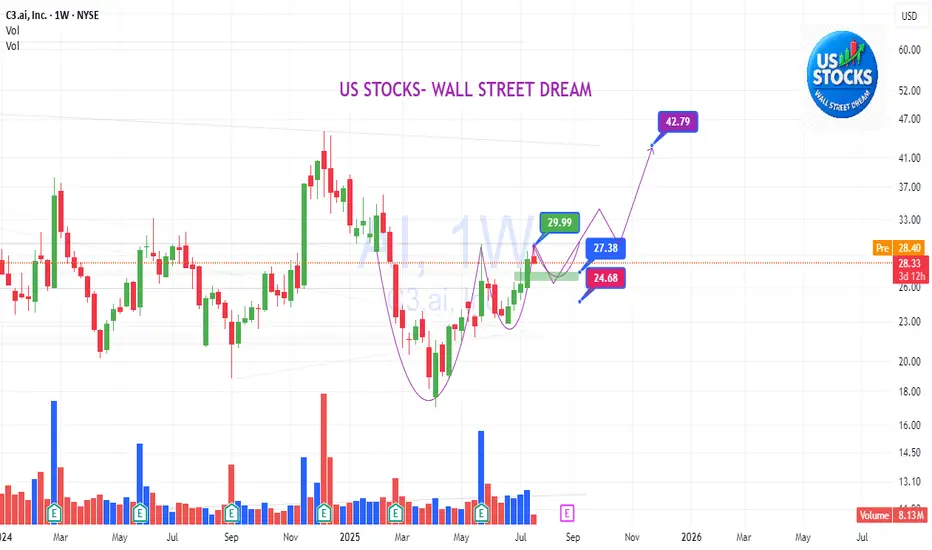
$AI is setting up for a 30% move!C3.AI - NYSE:AI Trade Setup
Inverse H&S Breakout that is now retesting.
A bounce here would confirm the breakout and lead to a MM up to $32.59 for a 30% move!

AI: Round 2AI
The market is really just that simple — it goes around in circles with the same style.
Will you catch AI and go up round 2?
.
US STOCKS- WALL STREET DREAM- LET'S THE MARKET SPEAK!

SPY, SPX, IWM, Natural Gas, NVDA, XYZ, AI - Analysis- Markets sold off into the NVDA rally this morning.
- Small afternoon rally turned indices back green
- Major pre market high levels up ahead likely allow us to push higher in coming days.
- NVDA should retest its premarket high levels.
- Profits secured on AI calls!
- Structurally indices are

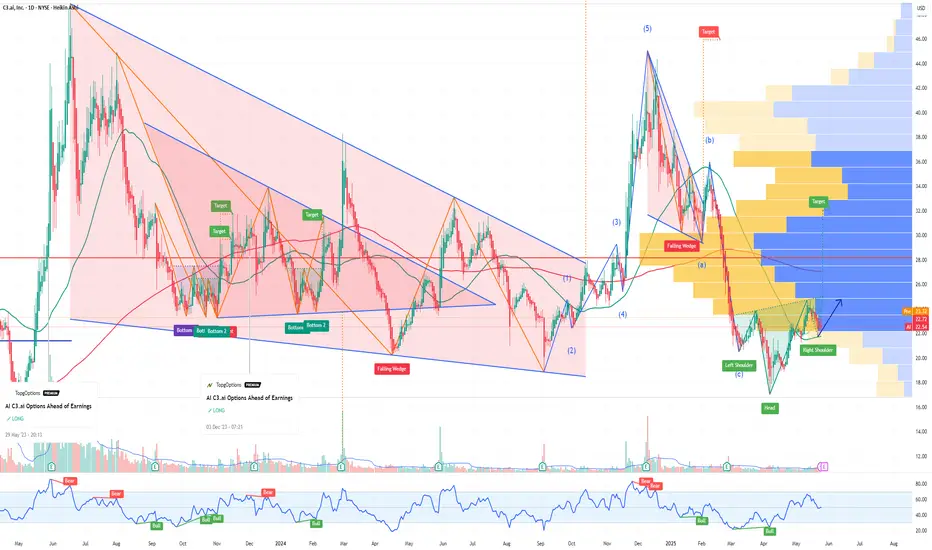
AI C3ai Options Ahead of EarningsIf you haven`t bought AI before the previous earnings:
Now analyzing the options chain and the chart patterns of AI C3ai prior to the earnings report this week,
I would consider purchasing the 23.5usd strike price Calls with
an expiration date of 2025-5-30,
for a premium of approximately $1.31.
If
$AINYSE:AI reports earnings post-market tomorrow.
👀 Watch the pre-market volume closely.
✅ If volume picks up, expecting range to hold (purple line on chart) with a move toward $25–$24.
🚀 Breakout above that could push price to $28–$29.
📊 NYSE:AI remains undervalued — once it clears the $30 zone, p

See all ideas
Summarizing what the indicators are suggesting.
Neutral
SellBuy
Strong sellStrong buy
Strong sellSellNeutralBuyStrong buy
Neutral
SellBuy
Strong sellStrong buy
Strong sellSellNeutralBuyStrong buy
Neutral
SellBuy
Strong sellStrong buy
Strong sellSellNeutralBuyStrong buy
An aggregate view of professional's ratings.
Neutral
SellBuy
Strong sellStrong buy
Strong sellSellNeutralBuyStrong buy
Neutral
SellBuy
Strong sellStrong buy
Strong sellSellNeutralBuyStrong buy
Neutral
SellBuy
Strong sellStrong buy
Strong sellSellNeutralBuyStrong buy
Displays a symbol's price movements over previous years to identify recurring trends.
Curated watchlists where 724 is featured.

Frequently Asked Questions
The current price of 724 is 19.565 EUR — it has decreased by −7.64% in the past 24 hours. Watch C3.AI INC stock price performance more closely on the chart.
Depending on the exchange, the stock ticker may vary. For instance, on XETR exchange C3.AI INC stocks are traded under the ticker 724.
724 stock has fallen by −13.02% compared to the previous week, the month change is a −7.27% fall, over the last year C3.AI INC has showed a −21.92% decrease.
We've gathered analysts' opinions on C3.AI INC future price: according to them, 724 price has a max estimate of 42.71 EUR and a min estimate of 12.81 EUR. Watch 724 chart and read a more detailed C3.AI INC stock forecast: see what analysts think of C3.AI INC and suggest that you do with its stocks.
724 stock is 8.79% volatile and has beta coefficient of 2.04. Track C3.AI INC stock price on the chart and check out the list of the most volatile stocks — is C3.AI INC there?
Today C3.AI INC has the market capitalization of 2.64 B, it has increased by 2.16% over the last week.
Yes, you can track C3.AI INC financials in yearly and quarterly reports right on TradingView.
C3.AI INC is going to release the next earnings report on Aug 27, 2025. Keep track of upcoming events with our Earnings Calendar.
724 earnings for the last quarter are −0.14 EUR per share, whereas the estimation was −0.18 EUR resulting in a 20.39% surprise. The estimated earnings for the next quarter are −0.12 EUR per share. See more details about C3.AI INC earnings.
C3.AI INC revenue for the last quarter amounts to 96.00 M EUR, despite the estimated figure of 95.15 M EUR. In the next quarter, revenue is expected to reach 91.11 M EUR.
724 net income for the last quarter is −70.38 M EUR, while the quarter before that showed −77.43 M EUR of net income which accounts for 9.11% change. Track more C3.AI INC financial stats to get the full picture.
No, 724 doesn't pay any dividends to its shareholders. But don't worry, we've prepared a list of high-dividend stocks for you.
As of Aug 2, 2025, the company has 1.18 K employees. See our rating of the largest employees — is C3.AI INC on this list?
EBITDA measures a company's operating performance, its growth signifies an improvement in the efficiency of a company. C3.AI INC EBITDA is −275.33 M EUR, and current EBITDA margin is −80.15%. See more stats in C3.AI INC financial statements.
Like other stocks, 724 shares are traded on stock exchanges, e.g. Nasdaq, Nyse, Euronext, and the easiest way to buy them is through an online stock broker. To do this, you need to open an account and follow a broker's procedures, then start trading. You can trade C3.AI INC stock right from TradingView charts — choose your broker and connect to your account.
Investing in stocks requires a comprehensive research: you should carefully study all the available data, e.g. company's financials, related news, and its technical analysis. So C3.AI INC technincal analysis shows the strong sell today, and its 1 week rating is strong sell. Since market conditions are prone to changes, it's worth looking a bit further into the future — according to the 1 month rating C3.AI INC stock shows the strong sell signal. See more of C3.AI INC technicals for a more comprehensive analysis.
If you're still not sure, try looking for inspiration in our curated watchlists.
If you're still not sure, try looking for inspiration in our curated watchlists.