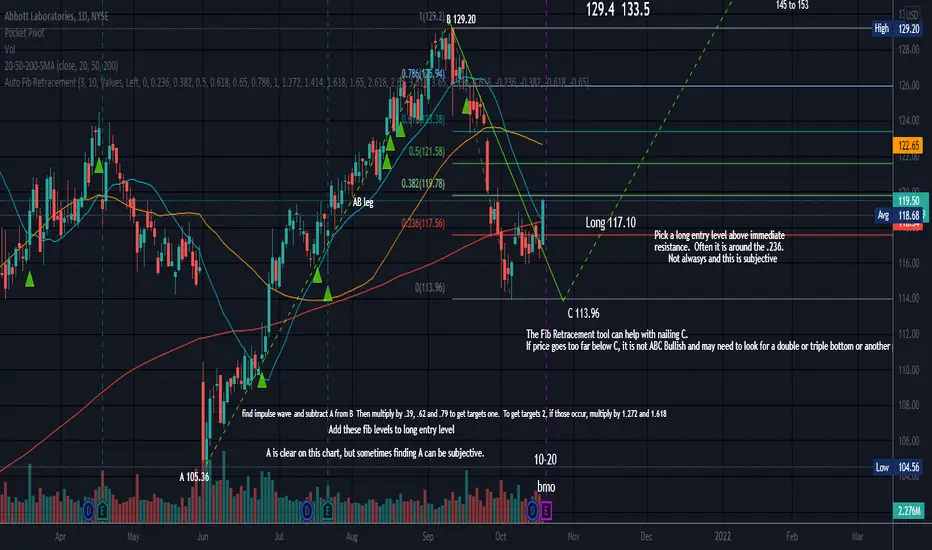
How to calculate ABC Bullish Patterns Earnings are 10-20 BMO!This is an example although calculations should be correct, but earnings will play a huge factor on this one since earnings are tomorrow morning.
I tried to explain calculations/procedure for an ABC Bullish pattern on the chart. This particular stock has earnings in the morning so may not be a good one to risk right now, but it is ABC Bullish before earnings. Any pattern can fail.
A few folks have asked me how to calculate this pattern so I tried. If you have questions feel free to ask.
In reality, it is an ABCD pattern, with the target being D. I do not call it ABCD or AB+CD because D is not here yet when you find long entry level and nail down C. If price travels too far below C, you may be looking at a double or triple bottom, or another pattern. Price may not make it to D, rr it can go beyond D. The pattern may fail and go below C. Price may retest C more than once. It is also possible that this pattern can morph in to another pattern. Nothing is written in stone and sometimes finding A etc. can be subjective. The AB leg in an ABC Bullish pattern is an impulse wave and should be a strong move UP.
There is also a bearish ABC pattern where the impulse wave is DOWN.
C has to be above A as this is a correction pattern and not a reversal pattern. It is considered a harmonic pattern.
Hope that helps (o:
No recommendation
ABL trade ideas
Short $ABT that made a double topABT made a double top and looks weak here. It could not hold the resistance.
Target $124

ABT finally broke out!I last spoke about ABT when it was peaking at a breakout. Now, with slightly higher than average volume, it finally broke out.
Now is the time to get in
Here's a recap of what I last mentioned
* Strong up trend
* Consolidating since beginning of 2021
* Strong earnings
* Lower than average volume
All signs point to it breaking out soon. Due to the lack in volume ABT may visit the $126 area before breaking out.
Trade idea:
* Wait for a break before entering
Target after breakout would be $151.65
Looking at its growth, ABT is a great long term hold that pays out dividends!

ABT to break out?* Strong up trend
* Consolidating since beginning of 2021
* Strong earnings
* Lower than average volume
All signs point to it breaking out soon. Due to the lack in volume ABT may visit the $126 area before breaking out.
Trade idea:
* Wait for a break before entering
* Look for an entry around $126 for a discount
Target after breakout would be $151.65
Looking at its growth, ABT is a great long term hold that pays out dividends!


Abbott Laboratories 2000-2021.According to the book Good to Great by Jim Collins, the stock achieved a fifteen-year result 3.98 times higher than the market in the 20th century. I want to compare that period in which the stock achieved excellent results and update that comparison with data from the 21st century to see how the stock has progressed further. For more details see my blog, an article should come out soon on this topic.

Abbott Laboratories 1974-1989.According to the book Good to Great by Jim Collins, the stock achieved a fifteen-year result 3.98 times higher than the market in the 20th century. I want to compare that period in which the stock achieved excellent results and update that comparison with data from the 21st century to see how the stock has progressed further. For more details see my blog, an article should come out soon on this topic.


160 TargetChart looking good here. taking last move under resistance and using that as next move. Slow but should continue to move higher.

Put Opportunity (ABT)ABT has been continuously failing to push above a Fibonacci resistance while also showing more signs of bearishness. The greatest of them is the divergence that can be seen from the Squeeze Momentum indicator. If a stock is increasing than the stocks momentum should also increase but for this case, that is not true. Another indication of bearishness is the Willy Oscillator giving a signal to sell, due to the stock being overbought.
Bearish Signals
-Bearish Divergence
-Willy Oscillator
-Fib Resistance

$ABT with a Bullish outlook following its earnings #Stocks The PEAD projected a Bullish outlook for $ABT after a Negative over reaction following its earnings release placing the stock in drift C
If you would like to see the Drift for another stock please message us. Also click on the Like Button if this was useful and follow us or join us.

Bull Run Incoming(ABT)The Weekly Displays that of a major up-move to be expected
-MACD displays continuous reduction in its selling momentum
- NYSE:ABT bounced off of its 20ma
-Daily Displays a bounce off of Fibonacci support
My first price target is the upper Bollinger Band which is 125, but I expect ABT to continuously rise until we see a reduction in buying momentum via the weekly. The %B indicator isn't signaling that of the greatest entry but it may be nice for those that want to catch the up-move. Although I am bullish on this stock, Powell will be speaking this upcoming week so the markets may be more volatile then usual.

ABT following earningsABT - Beat earnings estimates in sales and EPS. This was an earnings winner that surprised in both EPS and sales. I like this for a 125 call swing if we can hold up at 120.42. We broke this resistance on Friday and will have close eyes on it for a position in between this 120.4 & 121 range and should easily make it back to 124-125 if we can push out of this range.


Abbott Laboratories. $ABTGap down on the daily chart.
Gap filled with strong momentum.
Looking to back test and bounce off of top gap.
1y1d chart very strong. Bullish overall
PT: 120/125/130


Let's keep an eye on ABT! 👁ABT looks interesting, and it is worth to keep an eye on it! We have a pivot point at 109.52, and this might push ABT to higher levels. It must not break the 107.61, because we have a huge head and shoulders pattern here!
In the 4h ABT just hit one of the fibs retracements, and now it is ready to trigger the pivot point at 110.86.
If it breaks the first pivot in the 30min, I think ABT might close the gap at 116.51, but we’ll see.
We also have a support at 105.37, and we are doing some good movements from here. It seems a fine idea: Tight stop-loss and good upside potential.
If you liked this trading idea, remember to click on the “Follow” button to get more trading ideas like this, and if you agree with me, click on the “Agree” button 😉.
See you soon,
Melissa.


ABT with a nice inside day on FridayABT with a nice inside day on Friday. With earnings behind it, looking to buy through 125 with stop below 122.

$ABT with a Bullish outlook following its earnings #Stocks The PEAD projected a Bullish outlook for $ABT after a Negative over reaction following its earnings release placing the stock in drift C
If you would like to see the Drift for another stock please message us. Also click on the Like Button if this was useful and follow us or join us.

The LATEST Elliot Wave Count $ABT (ABC)I was long from $120 and Got out at the same price later.
Before going long I posted my elliott wave analysis but I'm not sure I did it correctly
Here now I have done a quick simple analysis again.
I can see that the weekly chart might be topping out. We might be into Wave B up and waiting for a Wave C down.
Let's see how it happens.
Check out my previous analysis attached below.

ABTHi everyone.
So, today I want to talk with you about swing-trading idea of Abbot Laboratories. This company works in medicine and drugs industry.
They show good results financial, some good dividend ratio with debts payments. Their big debts are typical for this kind of industry - medicine require big costs on science, study and creating costfull, effective drugs and equipment.
I think, that they will be good for swing trading, because expecting of new quartelly statement.
At now their price is overvalued, so everything can drop or rise with equal chances.
So tomorrow, (21.04) we will see on reaction of the markets on new earnings and statements.
