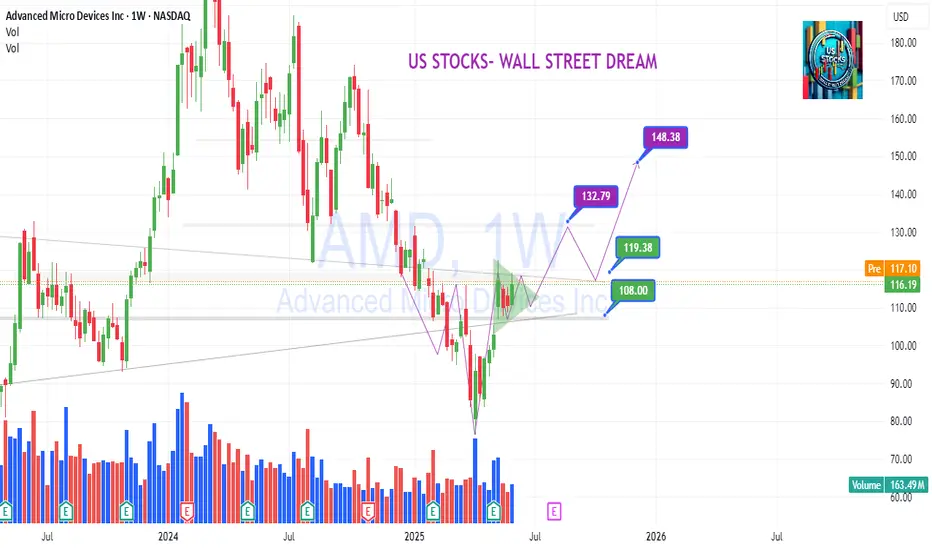
AMD First touch of 1W MA50 after 8 months!Advanced Micro Devices (AMD) hit today its 1W MA50 (blue trend-line) for the first time in almost 8 months (since October 28 2024). This is a crucial test as the las time this level broke as a Resistance following a Channel Up bottom rebound was on the week of January 30 2023.
When that happened, the Bullish Leg extended the upside to complete a +143.12% rise, before the next 1W MA50 pull-back.
As a result, if we close the week above the 1W MA50, we expect to see $185 before the end of the year.
-------------------------------------------------------------------------------
** Please LIKE 👍, FOLLOW ✅, SHARE 🙌 and COMMENT ✍ if you enjoy this idea! Also share your ideas and charts in the comments section below! This is best way to keep it relevant, support us, keep the content here free and allow the idea to reach as many people as possible. **
-------------------------------------------------------------------------------
💸💸💸💸💸💸
👇 👇 👇 👇 👇 👇
AMD trade ideas

AMD Elliott Wave Analysis: 5 Wave Rally Supports Bullish BiasSince bottoming out on April 10, 2025, Advanced Micro Devices (AMD) has embarked on a robust rally, signaling a bullish trend. Technical analysis reveals a five-swing sequence from the April 10 low, favoring continued upward momentum. The initial ascent, wave (1), peaked at $97.91, followed by a corrective pullback in wave (2) that found support at $83.75. The stock then surged in wave (3) to $122.52. A subsequent retracement in wave (4) concluded at $107.10, as depicted in the one-hour chart below. Currently, wave (5) is unfolding, structured as an impulse in a lesser degree, driving the stock higher.
From the wave (4) low, the subdivision of wave (5) began with wave ((i)) reaching $117.05, followed by a dip in wave ((ii)) to $108.62. The rally resumed in wave ((iii)), peaking at $119.40, with wave ((iv)) retracing to $114.25. The final leg, wave ((v)), concluded at $124.60, completing wave 1 of a higher degree. A corrective wave 2 unfolded as a zigzag, with wave ((a)) declining to $119.88. Wave ((b)) rebounded to $121.35, and wave ((c)) bottomed at $115.06. As long as AMD holds above $107.10, expect one more upward leg to complete wave 3. Then it should be followed by a wave 4 pullback and a final push in wave (5) to conclude the cycle from the April 10 low. This structured advance underscores AMD’s bullish outlook, with key support levels guiding its near-term trajectory.

Amd - This is just the beginning!Amd - NASDAQ:AMD - perfectly plays out:
(click chart above to see the in depth analysis👆🏻)
Despite the harsh drop of about -65% which we have been witnessing starting back in 2024, Amd remains bullish. Just three months ago, Amd retested a textbook confluence of support. We saw bullish confirmation, the bottom is in and Amd will rally significantly from here.
Levels to watch: $200, $300
Keep your long term vision!
Philip (BasicTrading)


AMD IS READY FOR A STRONG BULLISH MOVENASDAQ:AMD Right now, am extremely bullish on AMD.
I expect AMD to give a good bullish run to trail NVIDIA.
Technically, AMD is supper bullish right now, having had a multiple bullish break of structure on the daily time frame.
I took a long entry on the bullish break of structure on daily time frame. Stop loss is below the recent structure swing low.
What do you see on your chart?

AmdRising wedge here approaching 130-133 double top resistance..
Daily candle extended outside bband..
Look for a pullback to 96-105
Entry 127-131..
Stop loss - A close above 134.00
SOXL (Chip sector) hasn't broken out and the weekly candle finished bearish so I don't think AMD will move over 130
If price does close above 134 then 180 is incoming

Amd - This starts the next +200% rally!Amd - NASDAQ:AMD - is preparing a major rally:
(click chart above to see the in depth analysis👆🏻)
It has - once again - not been unexpected at all that we now see a major reversal rally on Amd. After the harsh drop of about -65%, Amd retested a significant confluence of support and already created bullish confirmation. It is quite likely that this now starts the next bullrun.
Levels to watch: $100, $300
Keep your long term vision!
Philip (BasicTrading)

AMD's Long Awaited Reversal Advanced Micro Devices (AMD) has maintained a well-defined long-term ascending channel since 2019, marked by cyclical touches at both the upper and lower bounds. The current setup signals a bullish reversal following a successful retest of the channel’s lower boundary
AMD now shows a strong bullish reversal:
✅ Broke above a multi-year downtrend line with volume support
📈 Currently retesting resistance $128, a breakout zone historically met with selling
🎯 Channel target projection: $300, offering 140% upside from current price
🔄 Price action consistently respects this trend structure with rhythmically timed expansions every 18–24 months
🧾 Fundamental Tailwinds (2024–2025 Context)
🔥 1. AI Infrastructure & Data Center Dominance
AMD’s MI300X AI GPU series has gained significant traction against Nvidia, with major cloud customers like Microsoft Azure and Meta adopting it for inference workloads.
Revenue from AMD’s Data Center segment surged >80% YoY in Q1 2025, driven by hyperscaler demand and Genoa EPYC chips.
Guidance for 2025–2026 includes double-digit YoY growth across AI and cloud sectors.
🧠 2. Product Roadmap Strength
AMD maintains competitive momentum with Zen 5 CPU launches and RDNA 4 GPU architecture set to arrive late 2025.
Management reaffirmed commitment to high-margin enterprise products and scalable AI inference.
📉 3. Valuation Reset + Earnings Reacceleration
After correcting from $164 to under $100, AMD entered a consolidation phase, allowing for multiple compression reset.
Now trading at ~35x forward P/E (down from 60x peak), with EPS expected to grow >25% YoY into FY2026.
💵 4. Balance Sheet & Buyback Support
Over $5.7B in cash, near-zero debt, and an active $8B share buyback program reinforce shareholder value.
Gross margin in Q1 2025 stood at ~51%, with continued improvements expected from data center mix shift.

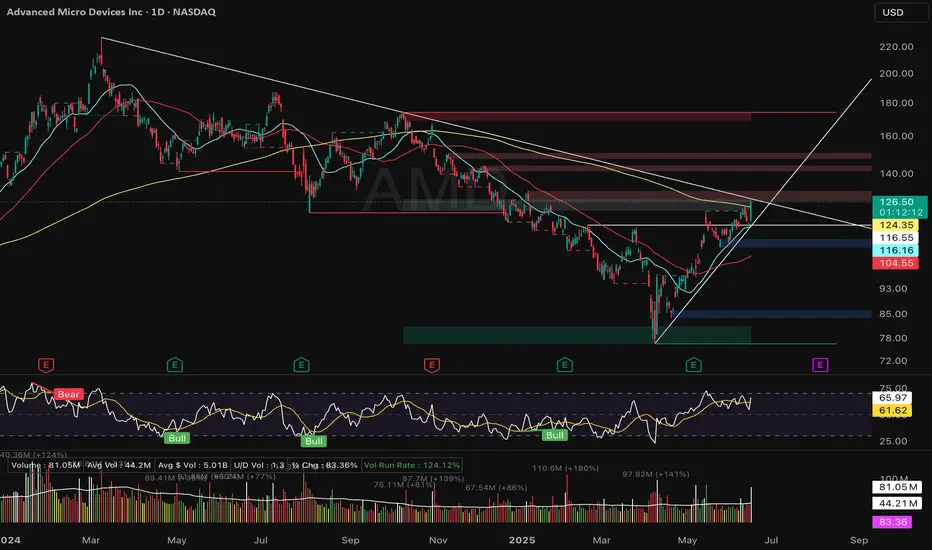
AMD – Breakout Watch (Daily Chart)NASDAQ:AMD surged +9.12% on June 16 with volume 1.8× above average, reclaiming the 200-day SMA for the first time in 7 months.
This marks a clear character change, but not yet a setup. Price stalled into multi-quarter trendline resistance around 128–130.
No pivot, no contraction — just strength into supply. Still needs to consolidate below trendline resistance for a valid trade.
Key Levels:
• Resistance: 130 / 145
• Support: 124.35 (breakout zone), 116.55 (MA stack)
• Watch for: Tight coil, volume dry-up, pivot pattern formation
Not chasing — watching for structure. Patience is a position.
📉 Weekly chart also reclaimed 30-week MA for the first time since Nov ’24.
#AMD #technicalanalysis #breakoutwatch #tradingview
Breakout Alert: AMD Head & Shoulders Points to $160+Overview
Name: Advanced Micro Devices, Inc.
Ticker Symbol: AMD
Exchange: NASDAQ
Founded: 1969
Headquarters: Santa Clara, California, USA
CEO: Lisa Su (as of 2025)Sector: Technology / Semiconductors
About
AMD is a leading semiconductor company known for its high-performance computing and graphics solutions. It competes with Intel and NVIDIA in the CPU, GPU, and data center markets. Its product line includes Ryzen (desktop/laptop CPUs), EPYC (server CPUs), and Radeon (GPUs), with strong expansion in AI and custom silicon for next-gen applications.
Fundamentals
Earnings: AMD reported strong Q1 2025 earnings with a beat on both revenue and EPS, supported by explosive demand in the AI and data center segments.Revenue: $6.52B, up 21% YoY
Outlook: The company raised guidance for the second half of 2025 as it expects to benefit from the AI chip boom and new product rollouts.
Technicals (4H Chart)
Inverted Head and Shoulders pattern confirmed with neckline breakout around ~$117
Breakout from Falling Channel aligning with bullish reversal structure
Price surged past resistance with strong volume, currently at $126.39 (+9.71%)
RSI at 65.88, approaching overbought but not signaling weakness
MACD bullish crossover, confirming momentum
Short-term target range: $145–$150, with extended projection up to $162.75
📌 Support Levels: $117, $111.50📈 Target Price (TP): $162.75 (based on pattern breakout height projection)
💡 My Take
AMD just pulled off a textbook bullish reversal — inverted head and shoulders breakout combined with a falling channel exit. With strong macro trends in AI hardware and data center expansion, this move feels well-supported fundamentally and technically.
The clean neckline breakout and explosive candle suggest continuation. I am expecting a potential consolidation around $130–$135ish before next leg to $150+. If momentum holds, $162+ is possible before August.
💼 Position
Type: AMD 145 Call
Expiry: July 03, 2025
Quantity: 15
Average Cost Basis: $.038
Date Purchased: June 12, 2025
Last Price: $0.47
Total % Gain/Loss: +23.4%
I entered after the neckline break and riding the wave. AMD’s setup is too clean to ignore — high conviction play.
AMD at Decision Point — Will $125 Hold or Break into Gamma Gap?🔬 GEX (Options Sentiment) Breakdown:
* Call Walls / Resistance:
* $128.89 = Gamma Wall (Highest positive NET GEX)
* $130.69 = 2nd CALL Wall
* $132–$135 = Heavy call congestion, unlikely unless breakout with macro tailwind
* Put Support Walls:
* $125 = Current Gamma Flip Level (critical)
* $122 / $121 = PUT support zone (GEX cluster + structure)
* $113 = 2nd PUT Wall (flush risk zone)
* Options Flow Metrics:
* IVR: 15.6 (modest)
* IVx avg: 48.3
* Call Flow: 33.8% (bullish leaning)
* GEX Sentiment: 🟢🟢🟢🟢 (moderately bullish, but fading under $126)
* Interpretation:
* AMD is trapped just below $128.89 Gamma Wall, failing to reclaim the high.
* If $125 breaks, dealer gamma hedging could intensify toward $122–$121.
🧠 15-Minute Smart Money Price Action:
* Current Price: $126.95
* Structure:
* CHoCH confirmed after rally peaked at $130.69.
* Supply rejection zone (pink box) held hard — price reversed and dropped into trendline test.
* Currently compressing between $126.40 and $125.06, right above the CHoCH floor.
* Volume:
* Fading volume = consolidation after weakness
* Watch for a volume spike at the $125 line to confirm breakout or bounce
* Trendlines:
* Still above ascending trendline, but momentum weakening.
🧭 Trade Scenarios for June 18:
🟥 Bearish Breakdown Setup:
* Trigger: Clean break and 15-min close below $125.06
* Target 1: $122.00 (PUT wall + support)
* Target 2: $121 → possible gamma flush zone
* Stop-loss: Above $127.20 (above minor CHoCH reclaim)
Gamma + SMC breakdown at $125 = likely acceleration to $122. Volume confirmation critical.
🟩 Bullish Continuation Setup:
* Trigger: Reclaim and 15-min close above $127.50
* Target 1: $128.89 (Gamma wall)
* Target 2: $130.69 (previous high + 2nd CALL Wall)
* Stop-loss: Below $125.50
Only valid if macro supports or SPY/QQQ bounce. Otherwise, just a fade opportunity for premium sellers.
💭 My Thoughts:
* AMD is hovering above a critical gamma/structure level at $125 — if it breaks, expect dealer flows to push it quickly toward $122.
* Volatility is still relatively low → options are priced favorably for directional trades.
* Watch SPY/QQQ correlation — if market remains weak, AMD likely leads tech breakdowns.
* Patience pays here — don't front-run. Wait for candle close confirmation at $125 or reclaim of $127.50.
✅ Summary for June 18:
* Bias: Neutral → Bearish
* Key Breakdown Level: $125.06
* Bearish Targets: $122 → $121
* Bullish Reclaim: Above $127.50 = potential move to $130
* GEX Danger Zone: Below $125
Disclaimer: This analysis is for educational purposes only. Always trade your own plan and manage your risk.

About to break outNothing much to say, chart speaks for itself
Breaking this structure will send this thing up hard

AMD is at the daily 200MA resistance The last 4 times AMD have rejected this moving average the result has been downside action

AMD - Reject or break the down trend?Been a long time AMD bull, even though it was the Advanced Money Destroyer under $100.
My position became a bit too large as I DCA, today I took off 30% of my position.
I am in a full position currently.
It has ran up nicely and can still run more in my opinion.
I would like to see it break the trend line and confirm a weekly close above it, then retest it as support in the low $100's
GLTA

AMD: Mapping Cycle via 3 FibsWaveform
High To High cycle Fib interconnection
Extension to the right matches recent bottom.
Expanding and anchoring the structure on L2L cycle
Levels around 3 intersections expose highest probability density.

$AMD Short to $105Personally I am avoiding the hype & FOMO on this stock. Big money is selling the headlines while retail FOMO get trapped. I will reenter longs in the $95-105 range. Setting stops around $128.

AMD looking at a uptrend resumption NASDAQ:AMD has broken out of the downtrend line since March 2024 and with the bullish morning star closing above the 9-period conversion and 26-period base line, AMD is on track to the upside. Furthermore, the stock has seen strong confirmation of a v-shaped rebound.
MACD and stochastic have confirmed the mid and long-term momentum returning. IChimoku showing strong three bullish golden cross and volume is strong.
Target is at 158.00 and 215.00 over the longer-term period.

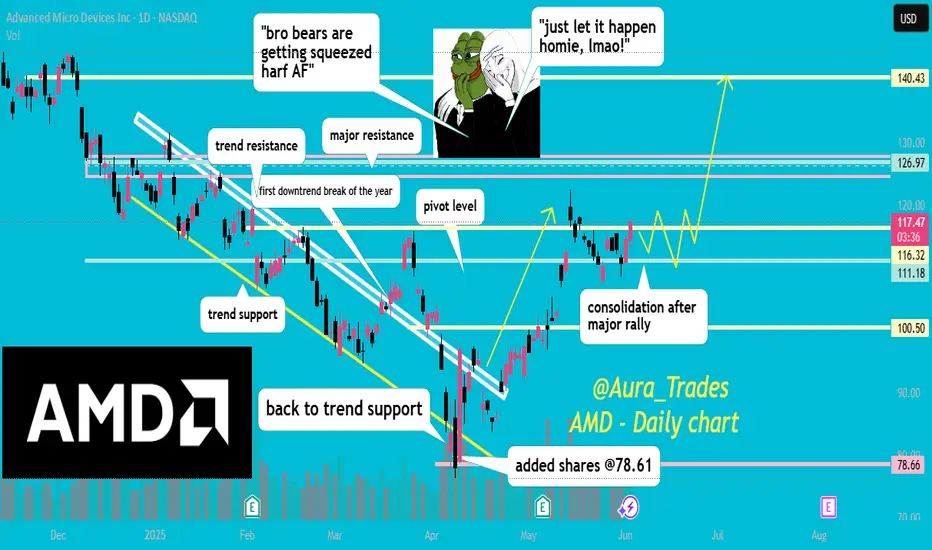
guess whos back? ;) boost and follow for more! 💖 congrats to anyone else who got AMD around 80, massive short trap below trend support and we finally got a break of trend resistance that has held!
I expect a bit of consolidation or maybe even a bit of profit taking, but after thats done a push higher to 126-140 will follow in my opinion.
side note: sorry for being so inactive this year, I've been going through a lot.. but I will try to post more often :)
AMD - Inverted Head & Shoulders (Bullish Reversal)Let´s see if we can break the neckline (White trendline) and stay above with a close and possibly a retest on the neckline to confirm this pattern. If so, Im looking for the previous top on daily which is the all time high (So far).
This is not a financial advise. Always do your own research and decision before investing.

Inverse Head and Shoulder on AMD 51%You can easily see this pattern just formed and perhaps playing out. This is huge and will not be too risky if stop loss is under the last shoulder but higher than the most obvious red candle .
Williams Alligator is supporting so better do it now

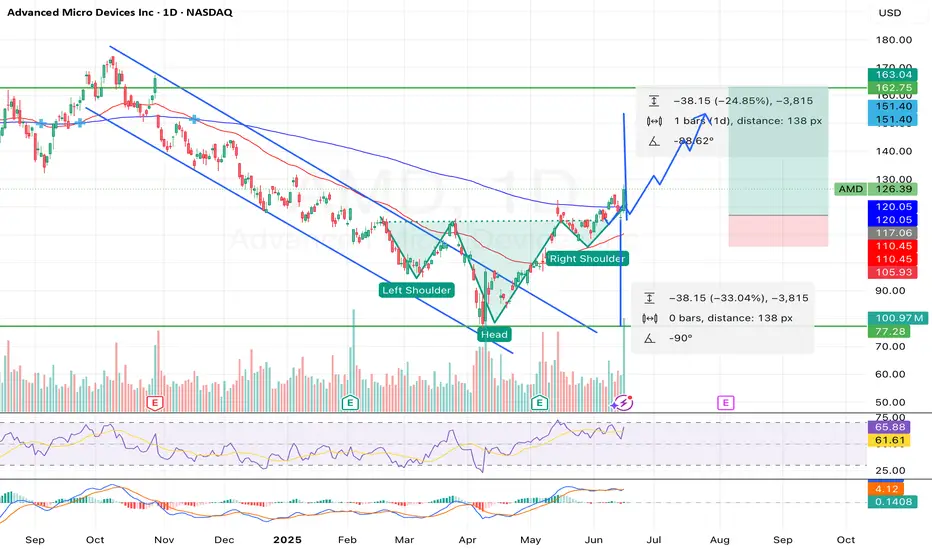
Inverted H&S on AMD BULLISH FOR MONDAY !!!! 150$USD JUNE END!!!Analysis of the Inverted Head and Shoulders
- Left Shoulder: The price first dipped, formed a trough, and then rebounded.
- Head: The stock dropped further, creating a lower trough than the left shoulder, followed by a recovery.
- Right Shoulder: A higher low formed, aligning with the left shoulder before the price moved upward.
- Neckline Breakout: The confirmation of this pattern comes when the price decisively breaks above the neckline (resistance level), suggesting a continued uptrend.
Potential Outcomes
- Bullish Breakout: Once the neckline is breached, a surge in buying pressure could push prices higher.
- Volume Confirmation: Increased trading volume at the breakout strengthens the validity of the pattern.
- Price Target: Traders often project the price increase by measuring the distance between the head and the neckline, then adding this to the breakout point.
Given the current price action, this setup could indicate a strong bullish continuation. However, market conditions and external factors should always be considered before making trading decisions.
If you want to refine this analysis or explore other scenarios, I'm here to dive deeper into key points! 🚀 Subscribe! TSXGanG
I hold a CCVM and MNC (Certificate of Competence to become a securities broker anywhere in Canada) and have been working as a trader for five years.
It’s a pleasure for me to help people optimize their trading strategies and make informed financial market decisions.

AMD: Simple chart with potential futureAMD: Simple chart with potential future
The market is actually simple, not as complicated as you think — as simple as this naked chart. Most people refuse to learn these simple things, or deliberately complicate matters just to appear like a pro trader.
.
US STOCKS- WALL STREET DREAM- LET'S THE MARKET SPEAK!
$AMD LongBands are super tight on $AMD. It's leading the market today up 4.29% while spy is barely breakeven .09%. Possible news meeting with China today
WH Sr. Adviser Hassett: I am absolutely expecting progress from US-China talks.
Progress from trade talks:
x.com
