CAT1 trade ideas

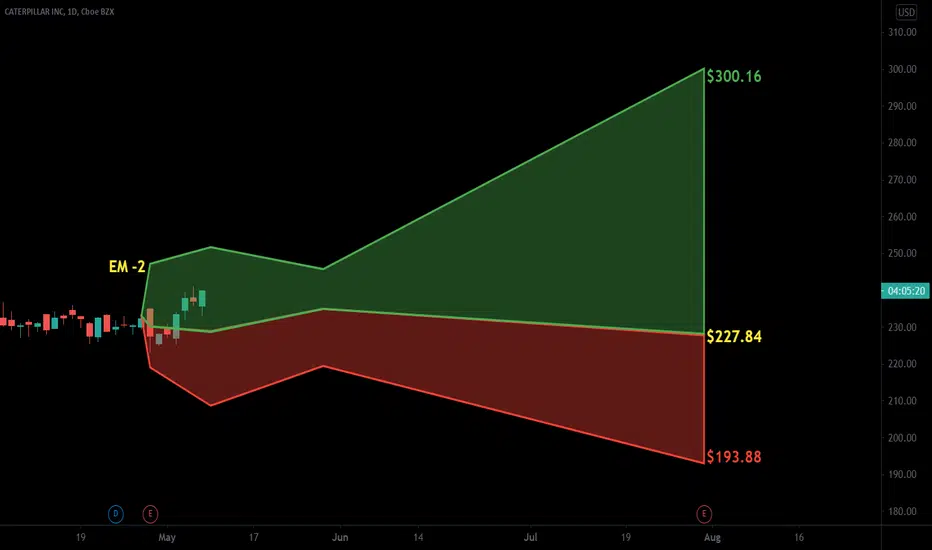
$CAT with a Neutral outlook following its earnings #Stocks The PEAD projected a Neutral outlook for $CAT after a Positive over reaction following its earnings release placing the stock in drift B
If you would like to see the Drift for another stock please message us. Also click on the Like Button if this was useful and follow us or join us.
CAT on watchlist (again)Cat longterm upward trend should be stable. With rasing oil prices and more demand on raw materials, they should receive a lot of demand of their products in the next years.
A possible drawdown could be taken as a entry for a long term invest.


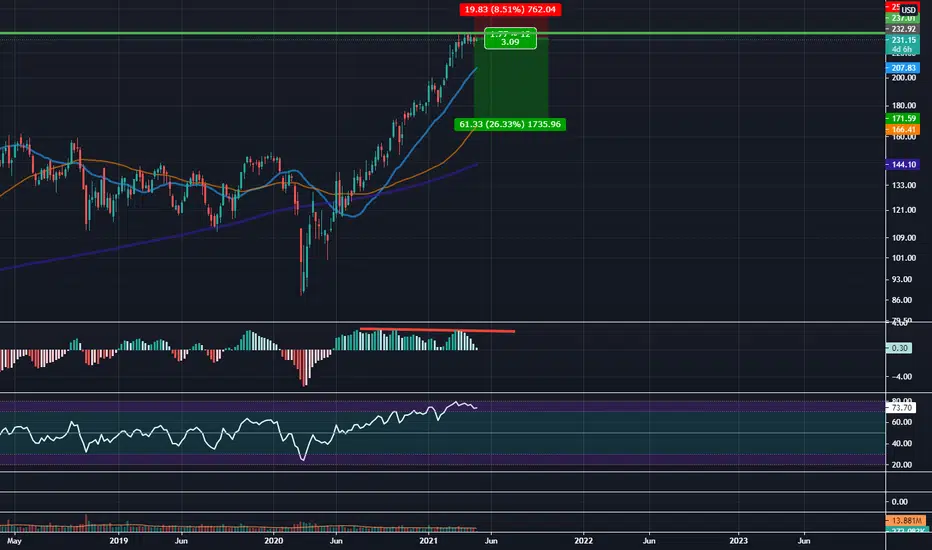
Caterpillar’s Big Candle at the 50-day SMACaterpillar was the best performing member of the Dow Jones Industrial Average in the last year with a gain of more than 115 percent. It’s paused since mid-February and now the chart is showing renewed signs of life.
First and foremost is the 50-day simple moving average (SMA). CAT bounced at that line several times, including late October and mid-January. The bears tried to break it in on April 29 but prices keep closing above it. That shows buyers are still active.
In fact, Tuesday morning was one of those times as sellers drove the industrial giant back under $226. They retreated a few hours later, resulting in a large bullish outside candle. It was also the highest close in the past month. Those signals could bring new money off the sidelines.
Finally, the recent range has been so tight that Bollinger Band Width has squeezed to its narrowest reading since August 2017. That moment, by the way, was followed by a breakout to new highs.
TradeStation is a pioneer in the trading industry, providing access to stocks, options, futures and cryptocurrencies. See our Overview for more.

CAT bear call spread
CAT bear call spread
CAT rally up into an 1h liquidity shelf 232-234 RBD origin supply zone.
At the time, it looked good as I got the alert.
Sold 237.50 calls with 240 bought.
3 DTE, 22% ROI
Now that I look at it doing this write up, the Apr 29 opening candle was a liquidity spike search up at the open.
I should've waited until above 234.70 and sold the 240 strike.
I did my best to structure the trade behind all the March and April spike highs.
So market must break the range and hold it up there to get me.
Hopefully buyers run out of steam in the 233 range and sellers start to exert again to give me a push lower into Friday


$CAT 2021-APR-28$CAT looks like it has hit some resistance around $235. If the channel holds up; a breakout from here could present some great potential value.

MACD Bearish Divergence; RSI Overbought: Pullback LikelyCAT will probably pullback from around these levels and find some support at the moving averages.
CAT Price MovementBased on the chart, we see there is a support level of $227 and a resistance of $238. The Bollinger Band (45D) suggests that the price is about drop being that it is above the midline, pushing the upper band. Furthermore, Andrew’s Pitchfork is yet another confirmation of a falling price. Some other key indicators are the RSI, Stochastic Oscillator, and MACD, which are all signaling a sell off in the near term. Below are the numerical values for those. Also, look at the value. There is a depletion of customer sentiment and buying so the price will continue to drop to the support range.
What I foresee happening is a price drop to around $225 to $227, which will require entry confirmation to maximize profits. Furthermore, I foresee the long-term value of this firm to be $284 based on both fundamental values, historical chart trends, and enterprise value. Keep an eye on their earning as well. Based on what they reported last earnings call, they were above 2.12 but had to make adjustments and it was standardized at 1.42, falling short but their price still surged. I foresee this happening again. They are expected at 1.94 but I believe it will be 2 based on what they are doing at the moment. Again, I see the price dropping to around $225 from most recent data then increasing to $245-250 (8.88% to 10%) but ultimately hitting $284 for long term investors.
Here are the fundamental and technical data highlights:
- Sector: Industrials
- Industry: Machinery
- Market Cap: $127.25B
- Volume: 1.61M
- Revenue Growth Rate (Avg): 11.5%
- Net Income Growth Rate (Avg): 7%
- Cash-On-Hand: $8.8B
- 1-YR Returns: 115%
- EV: $155M -> Puts (PT) price target at ~$284 – intrinsically)
- ROE: ~22%
- Altman Z-Score: 2.3
- Bollinger Band (30) in contraction with price accumulation
- RSI: 62, minor sell signal
- Oscillator: 66, slightly overbought, confirming sell-off soon
- Andrew’s Pitchfork: Lower band broken
- MACD: Sell off with decreased volume
News around CAT:
- Energy & transportation segment back online and fully operational according to February 10K Annual Report
- Discontinued EIP shares repurchase plan 2nd half of 2020 but continued in 2021 Q1
- Brought in Gerald Johnson, Executive VP of Global Manufacturing of GM on March 1 – to target automotive production
- Energy include oil and natural gas
According to (EIA) U.S Energy Information Agency, WTI crude oil is at $63.46 per barrel, over doubled from last yr. Natural gas is at $2.658 MMBtu, over doubled from last year. Oil & natural gas inventories are down 11.2M barrels from a year earlier and 242 bcf from a year earlier. Current = 492M barrels and 1,845 Bcf. This means that demand is high and with continuation of operations and CAT being industry leader with a large volume of government contracts, they are going to see a large spike in revenue with major increases in overall stock value.
Happy Investing!

$CAT Short-term swingCAT looks bullish again on the daily chart. Looks ready in the indicators as they've turned bullish yet again. Both the RSI and Stoch RSI had a crossover last week. We put in an inside day last week after being below the recent pullback's VWAP and reclaimed demand on the upside. Looking closely at price action to confirm a bullish trend to continue higher or to reverse below the highs' anchored VWAP. It is also looking like a short-term flag that could break out from.

$CAT Daily Head And Shoulders 4/12 (Healthy Pullback)Video breakdown on $CAT going into 4/12-16
CAT has Rejected New highs and set up a head and shoulders. It seems to be sitting on top of its 20 EMA and best respects the 50EMA which is my target if the H&S plays out. More videos on my tradingview page $220 P for 4/16 closed at .34 not a bad risk to reward.

Strong value pickCAT looking strong with all four EMA lines, in a perfect setup.
RSI keep the momentum above 50.
Low volume sell-days
Low risk to supportzone

CAT continues showing strengthWeak dollar, infrastructure, CAT has historically shown it is the best US stock that performs in these environments. Biden soon announcing infrastructure, if it goes through (unlike the previous adminstrations) expect this name to get a lot of love. Bullish divergence.
Calling the top on CAT hereRight at long term resistance. Rising wedge breakout and very overextended on the monthly Bollinger band.


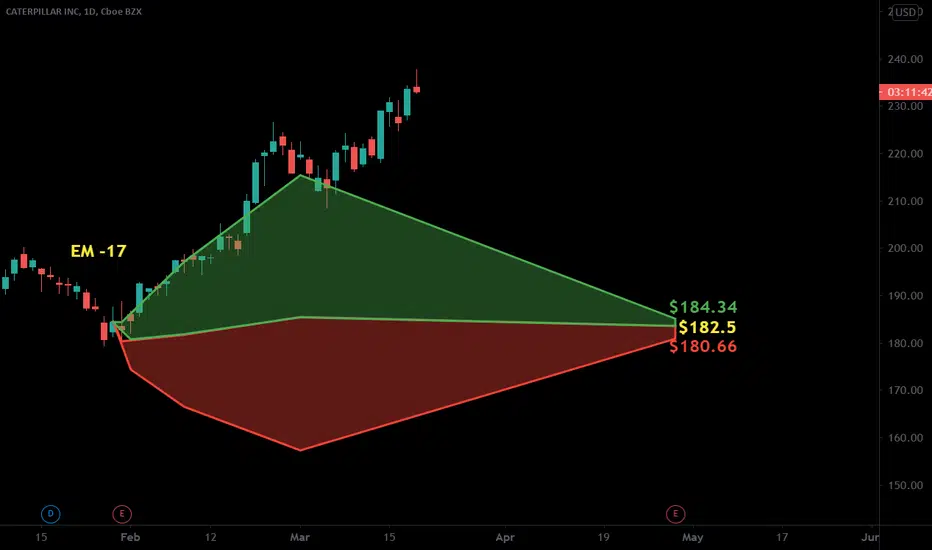
$CAT with a Neutral outlook following its earnings #Stocks The PEAD projected a Neutral outlook for $CAT after a Negative over reaction following its earnings release placing the stock in drift C
If you would like to see the Drift for another stock please message us. Also click on the Like Button if this was useful and follow us or join us.
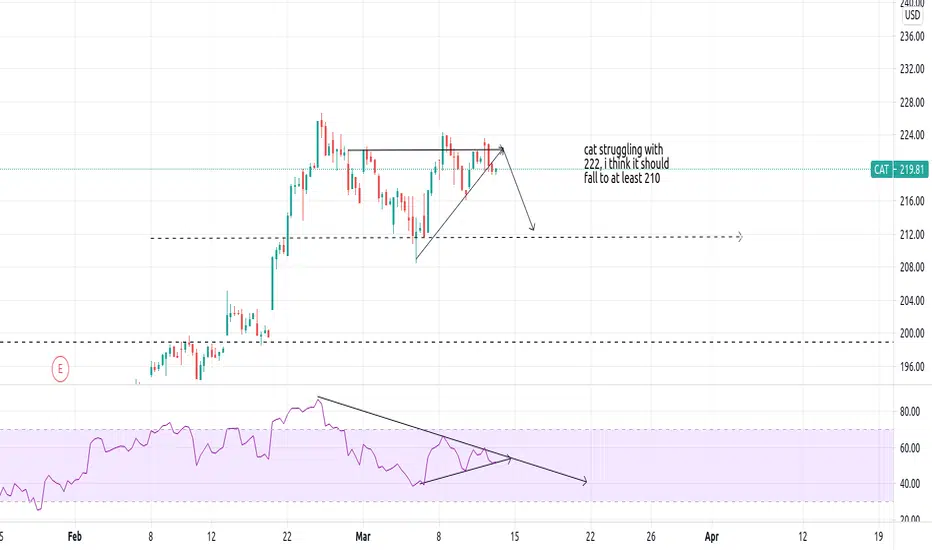
cat cat remains weak, in my opinion, should soon fall further , stop loss above 224 a solid close on the 2hr candles
cati think cat showing some divergences on the 2hr, formed a lower high as well, if today it doesnt move past 23 bears could be in trouble

CAT Stock 08/03/21 Analysis 4H ChartNYSE:CAT (CATERPILLAR: CAT)
- Trend Analysis -
📑Value: 8/20
📈Growth: 16/20
💰Profitability: 20/20
🚀Momentum: 16/20
💸Earnings: 16/20
🖇️Total Score: 76/100


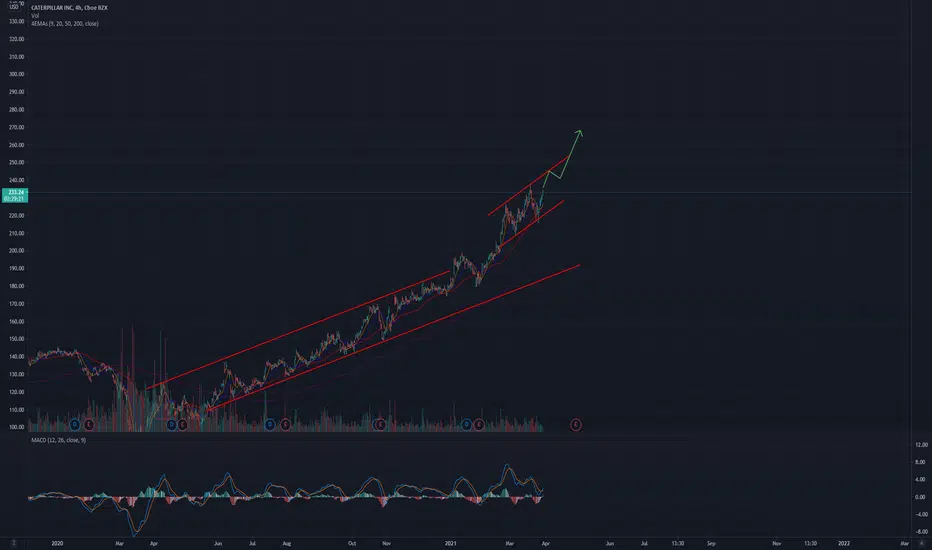
CAT on observation Great chart and opportunity to catch CAT on this move :)
ABCD chart in the combination with ascending triangle and great FIBO. :)
Thank you for reading this, if you like an idea of CAT press like button and leave a comment :)

Kitty ideaI think it will pull back short term. Heikin ashi candles looking like a pullback could happen
