CMC trade ideas

$JPM - Financials 9/10Honestly it could have been either BLK or JPM. They both run the country's financial system and are the backbone of it. As well as most other major countries in the world. You may not like the financial sector, but these two names will never go under without the entire country going down.

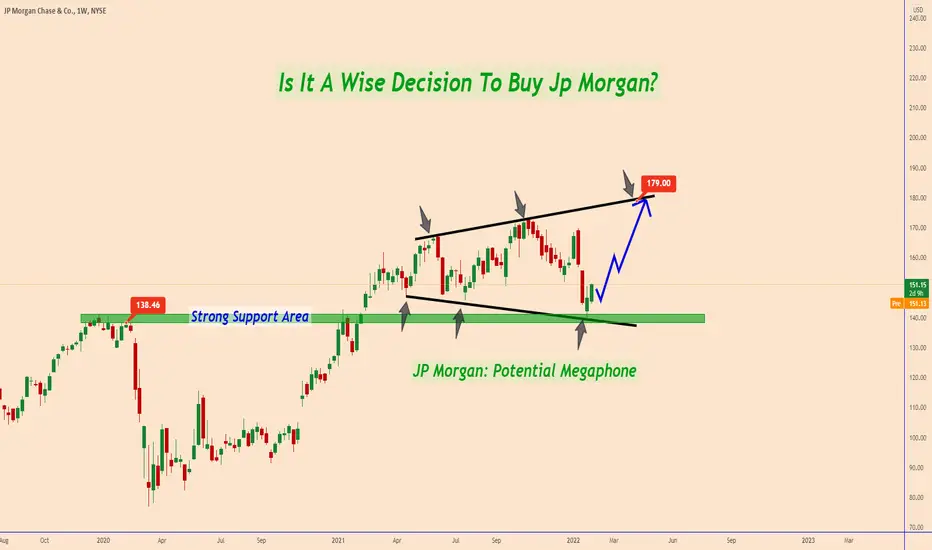
JPM Price Analysis: Is It A Wise Decision To Buy Jp Morgan?Is It A Wise Decision To Buy Jp Morgan?
As we all know, JP Morgan is a highly reputable bank in the market.
The current Market Cap is $ 442.73 billion
Industry: Banking - Diversified
Financial indicators are all in positive territory.
The chart shows that from February-20 this bank recovered the entire price decline due to the collapse of Covid-19 in a matter of 10 months.
From that moment on it is still holding up the growing momentum.
The stock is not overvalued at all.
On 24-January-22, the price tested a strong support area that belongs to pre-pandemic price, close to 140.
Also, an upward price reaction can be seen in that support area because the price has already risen from 140 to 151.
This increase is approximate + 7.5%.
Considering this, we can assume that this stock is being traded close to its “Fair Value”.
So we are not buying something that is more expensive than it should be.
The probability is very high that the price could move higher again up to the top of the model close to 179.
Thank you and Good Luck!

JP Morgan Chase & Co 12 Month Negative DivergenceAs you can see, the highs of the 00s and the top of 21' have manifester a negative RSI divergence.
We could be near something big, this is only one of many.

JPMorgan Chase | Fundamental AnalysisDespite the high valuation and declining stock price following the release of its Q4 and full-year 2021 earnings report, analysts still believe that JPMorgan Chase is the best-performing banking asset of its kind. After all, America's largest bank by asset size generated more than $125 billion in earnings on a managed basis in 2021. Still, the bank may struggle to deliver the returns investors have grown accustomed to in recent years because of some near-term adversity. And here's why.
One way to estimate JPMorgan's accomplishments on a quarterly and annual basis is the return on tangible total capital (ROTCE), which is a technical rate of return on equity after dismissing selected stock, charity, and intangible assets. It is definitely a strong number, taking into account the intricacy of the bank and the amount of regulatory capital it must have. In recent years, JPMorgan has mostly exceeded its target of 17%.
In 2019, before the pandemic and when the federal funds rate was higher, which is apt to help banks, JPMorgan Chase reported 19% ROTCE. The bank reported 14% ROTCE in 2020 and then 23% in 2021. However, both ROTCEs in 2020 and 2021 were significantly influenced by reserve capital. In 2020, JPMorgan had to set aside a ton of funds to prepare for potential loan losses, which significantly reduced profits. In 2021, realizing that these loan losses would not be realized, JPMorgan put the reserve capital back into earnings, which increased ROTCE significantly. When the reserve capital was drawn out in 2020 and 2021, JPMorgan's earnings were 19% and 18% ROTCE, respectively.
How did these numbers do so well with so little credit growth and low interest rates over the past two years? The bank's Corporate & Investment Banking (CIB) division had an outstanding year, first in capital markets and then in investment banking in 2021. But as earnings at CIB are expected to normalize this year and interest rates remain relatively low, all things considered, achieving the 17% goal becomes more challenging.
No doubt much of the sell-off after JPMorgan's Jan. 14 report was due to the bank's guidance, which was somewhat muddled and seemed to suggest less fortunate outcomes this year and possibly next.
One of the main metrics on which banks typically provide guidance is net interest income (NII), which is the money banks earn on loans and securities after covering the cost of funding those assets. When the Federal Reserve raises its benchmark overnight lending rate, the federal funds rate, banks tend to earn more NII because the yield on their assets, such as loans and securities, is revalued based on the federal funds rate higher than the rate on their liabilities, such as deposits. JPMorgan does expect NII to grow as a result of rising rates. In 2021, NII from loans and securities was about $44.5 billion. With expected rate increases this year, some growth in loans and securities placements, JPMorgan expects that to grow to about $50 billion in 2022.
But JPMorgan also gets NII from the bank's CIB Markets division, mostly from the bank's fixed-income capital markets business, doing things like holding bonds and some customer lending and financing. This was very high in 2020 and 2021 at $8.4 billion and $8.2 billion, respectively, but is now expected to normalize as rising rates also drive up the cost of funding fixed-income assets. In 2019, when the economy was more normal, the NII of CIB markets was only about $3.1 billion. Thus, while JPMorgan is expected to benefit significantly from rising rates, NII may be offset to some extent by lower NII in CIB markets, although this NII is harder to predict.
JPMorgan's spending forecast also took analysts by surprise. After spending just under $71 billion last year, management expects spending to reach about $77 billion this year, a slight increase. About $2.5 billion of that increase will go toward employee compensation and normalizing travel and entertainment expenses, and about $3.5 billion will go toward investments in the company, such as technology capabilities, expansion, and marketing.
As analysts noted, such spending growth is likely to make it difficult for JPMorgan to get positive operating leverage this year and possibly next, when revenue growth outpaces expense growth.
But CEO Jamie Dimon said reaching 17% ROTCE is not out of the question in 2023, depending on factors such as the performance of fixed-income capital markets and the deployment of excess cash, on which the bank has been conservative. Investors also seem somewhat disappointed that JPMorgan has significantly increased its investments in the company over the past few years, so they want those investments to be reflected in earnings.
JPMorgan stock has been priced pretty high, and it will face some difficulties in the coming years. At this point, there is probably potential for much higher returns in stocks like Citigroup and Wells Fargo, which are on a turnaround. But they also carry a lot of risks, while experts are confident that JPMorgan management is managing the company wisely and investing to handle all the competition in the banking sector now and in the future.

JPM After Earnings PlayJPM has great potential for a turnover. The stock plummeted shortly after the earnings report showed shortcomings regarding revenue. On the chart, JPM looks to be down trending onto a strong support zone. After hitting support levels, we can see a reversal.

NYSE: JPM/ JP Morgan bullish reversal by tomorrowJP Morgan has been ranging for a few months now. I anticipate it to do the same thing it's been doing thus far and continue consolidating. We look to see a rejection in today's trading session and a confirmation of a bullish reversal by tomorrows trading session. JP Morgan will bounce off our strong support cluster to continue ranging until we get a confirmation of a clear breakout in either direction.

Attempt at Wave Confirmation (1d) (Jan 2022)JP Morgan & Chase ( JPM ) (January 2022)
I still believe there may be an Elliott wave in this chart printing since the March 2020 market-wide crash. I've had to update since the last time I published but I was able to clean up this chart. I will try to watch this one more frequently now.
I think the next drop will end near ~$140 or even ~$130 depending on our suspected 4th wave here. Looking for a 50% or 38% retrace to confirm a 4th wave, those 2 price levels would satisfy that condition for me. It seems like it has already retraced further than 24% (<0.786) so I expect at least $140 or $130 if this is a true Elliott wave. I suspect this drop could continue from now into March or May 2022.
After a drop to one of the suspected levels for 4th wave, I expect a 5th wave that could end at either $170 (red/gold fib 1.0) or $191 (red fib 1.27/gold fib 1.618) anytime from December 2022 to February 2023. A final peak of $170 would make wave 5 a "failed 5th wave" and would probably support the fundamentals of a "double top" chart pattern as the suspected wave 3 ended along the same level.
Note the 3 moving averages converging on the price range I indicated for a 4th wave.
Previous chart leading to these conclusions:
Thanks for tuning in :) Disclaimer, anyone in the trade needs to do their own due diligence and decide what is right for YOU. My charts can be wrong at any time and it's very important that you have your own strategies and plans in place. I run this channel for my own educational purposes of learning to trade, and I will never be 100% right, so please do not let me confirm any bias for you! (Dangerous to do so, stay safe and remember the basics & rules of risk assessment.) Expect the unexpected and happy trading!

$JPM with a Neutral outlook following its earnings #Stocks The PEAD projected a Neutral outlook for $JPM after a Negative Under reaction following its earnings release placing the stock in drift D with an expected accuracy of 75%.
If you would like to see the Drift for another stock please message us. Also click on the Like Button if this was useful and follow us or join us.
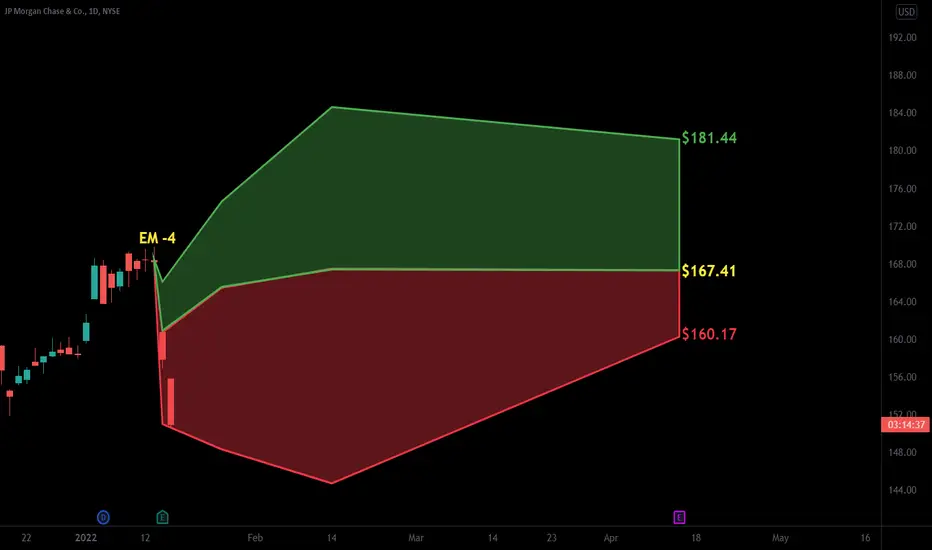
JP Morgan earnings on 1/14 at 6:50amJP Morgan Chase (JPM) Q4 December 2021 earnings are on 1/14 at 6:50am. JP Morgan Chase (JPM) reported Q3 September 2021 earnings of $3.74 per share on revenue of $31 billion. JPMorgan Chase had $3.8 trillion in assets and $290 billion in stockholders equity as of September 30, 2021. The setup for bulls was better a few days ago, now it's likely a better setup for bears. With that said, I'm neutral leaning bullish here because of the institutional rotation into financials for 2022, Fed quantitative easing tapering and anticipated rate hikes, along with a possible Q4 earnings flat, but with a positive Q1/2022 earnings guidance in the conference call. Here's the 1 day price levels.
Q4 Consensus:
EPS = $2.97
Revenue = $29.71B
P/E = 10.62
Div /Yld = 2.205
52 week high = $172.96
52 week low = $123.77
SMA200 = $159.29
SMA150 = $160.16
SMA100 = $162.73
SMA50 = $163.27
breakout = $167.53
R3 = $165.16
R2 = $162.79
R1 = $160.42
pivot = $158.05
S1 = $155.68
S2 = $153.31
S3 = $150.94
breakdown = $148.57
Do your own due diligence, your risk is 100% your responsibility. This is for educational and entertainment purposes only. You win some or you learn some. Consider being charitable with some of your profit to help humankind. Good luck and happy trading friends...
*3x lucky 7s of trading*
7pt Trading compass:
Price action, entry/exit
Volume average/direction
Trend, patterns, momentum
Newsworthy current events
Revenue
Earnings
Balance sheet
7 Common mistakes:
+5% portfolio trades, capital risk management
Beware of analyst's motives
Emotions & Opinions
FOMO : bad timing, the market is ruthless, be shrewd
Lack of planning & discipline
Forgetting restraint
Obdurate repetitive errors, no adaptation
7 Important tools:
Trading View app!, Brokerage UI
Accurate indicators & settings
Wide screen monitor/s
Trading log (pencil & graph paper)
Big, organized desk
Reading books, playing chess
Sorted watch-list
Checkout my indicators:
Fibonacci VIP - volume
Fibonacci MA7 - price
pi RSI - trend momentum
TTC - trend channel
AlertiT - notification
www.tradingview.com

JPM looks bearishPure technical standpoint
Formation of a "Rising wedge" + hitting strong resistance. RSI forming lower highs

JPM Longweekly Wedge breakout + retest
Entry 160
Stop 155
Target 180
Risk management is much more important than a good entry point.
I am not a PRO trader.
In my trading plan, the Max Risk of each short term trade should be less than 1% of an account.

JPM ready for run upTrying to consolidate at the support area, nice add here going into next year where we expect slowly FED tapering will start.

JPM JPMorgan Chase Neutral1- CCI 20 is perfectly over 140. (sideway )
2- a little close to Resistance than support. ( little bearish )
3- The red line is over the White line of “ACL” (self-made indicator) .( Bullish ) (ADL indicator)
4- "Multi analyzer" (self-made indicator) is uptrend and is 5 right now. ( Bullish )
5- Close is over the red and white line ( Bullish )
6- Mid-term channel (LR of 9months) is ascending (Bullish )
7- Long-term trend is Bullish ( little Bullish )
8- In bottom half of Mid-term channel ( bearish )
9- around middle of channel ( little bearish )
Overly , Bulls are stronger
Buying is suggested in reaction to bottom of the channel.
Buying is also suggested after breaking the resistance around 173$
SL: depend on the setup (I will clarify later)
TP1 : depend on the setup (I will clarify later)
TP2: depend on the setup (I will clarify later)
Beyond the technical: (do your analysis, I’m not educated in the case of fundamental analysis academically)
Fair Price to Intrinsic Value: 2.72
To summarize my fundamental opinion on this stock:
A little bad ( a little bearish)
In case of good stocks I prefer to be an investor not a trader, but trading with lower Trading with smaller amounts can increase the overall profitability without any unreasonable risk.

$JPM With earnings on deck!$JPM Earnings on deck! JP speaking Tues, this is setting up for an interesting trade... Loading on a pullback with stops at Friday's low.
5%+ IV time skew w/ earnings coming on the 14th for options!
$170C calendars would give a really nice edge here

JPM Ex-Dividend 2022-01-05JPM pays a $1 dividend tomorrow. Company is performing well, wanted to compare performance to peers.
Interesting to see JPM up less than its peers in the financials industry who all started 2022 with a strong bullish day.

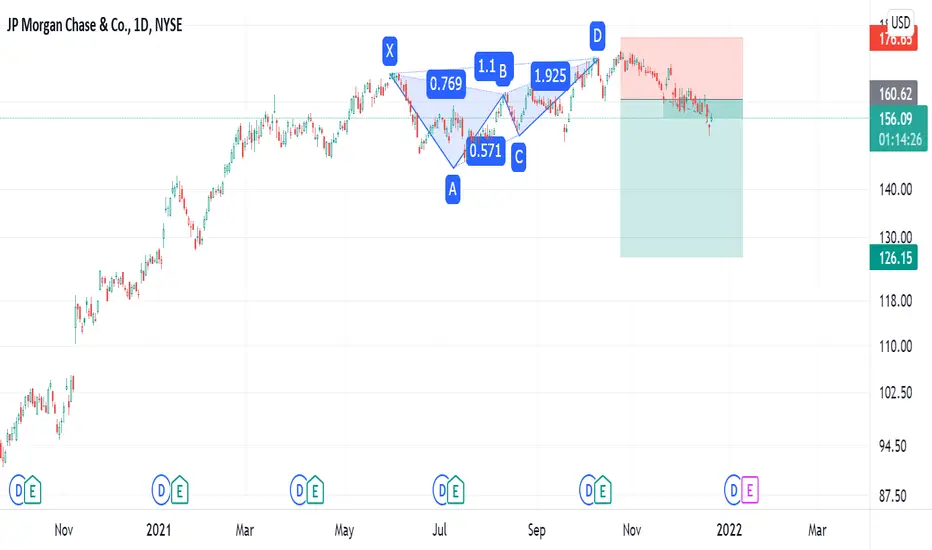
JPM bearish Elliot waves After making a high on the harmonic butterfly pattern JPM has reached a critical inflection point where we're probably going to see either the trend continue or an important break. A breaking of the current support might give us our 5th wave in an Elliot based drop. If that's the case, then the next rally can turn into a huge bull trap.

JPMorgan ChasePotential double bottom setup here. I like this companies financials. It's a credit card company so I'm thinking about the attractiveness of reward points and holiday spending. Even though it's not estimated to be a great holiday season for some, I'm more so thinking about the surcharges and end of month billing here. Chase is also a bank on top of that and just in case they raise interest rates, this may not be a bad move. I want us to reach anywhere between 50-68% of the previous high which was set inn October. I love financials around this time of the year. Let's see what happens!
Not Advice!
Only an Idea!
This trade may end up going wrong. That's the nature of trading! Let's keep getting better!

JPM might take a real hammering over the next yearJPM has rejected off a butterfly high and may be now into the development of an Elliot wave 3 in the start of what will become a reversal of JPM. JPM looks like it is at risk of taking a very heavy hit in the coming year or few.
JPM SHORTRSI is below well below 40, volume is extremely low, stocks are not having a Santa Rally nor should Wall Street!

JPM - INSDE DAY BREAKOUT EXAMPLEon 12/15 JPM had an inside day and on 12/16 i was watching to see if we would break above.
I took the 12/23 160C at $2.02 and exited when we didn't break the pivot at 2.82

JPM loses trendline support JPM and C have the most bearish charts of all the banks ..
Here you can see by the volume that Investors have been dumping this since NOV. Closed below trendline support but but bounced off its weeklys 50sma. if it falls below that weekly 50sma we are headed back to 141support.
This chart actually goes contrary to my view of XLF rallying. I'll have reevaluate XLF is JPM loses its 50sma
