4H Chart: How Meta's Double Top Turned Into a Reversal Buy How Meta's Double Top Turned Into a Reversal Buy Signal on the 4H Chart
Meta Platforms Inc. (META) recently formed a classic double top pattern, which is often interpreted as a bearish reversal signal.
The price touched a key resistance level twice and then pulled back, triggering caution among technical traders. However, the
stochastic RSI on the 4-hour timeframe is now flashing a potential reversal buy signal that could shift market sentiment.
This hidden momentum may catch short sellers off guard. Here’s a breakdown of the setup:
Technical Breakdown
1. Double top formation
Resistance was tested two times, forming a temporary ceiling.
Typically, this signals a possible trend reversal.
However, there has been no strong bearish follow-through after the second top.
2. Stochastic RSI buy signal on the 4H chart
The %K line has crossed above the %D line in oversold territory.
This suggests a potential bullish reversal.
RSI is also recovering from a low zone, pointing to increasing buying pressure.
3. Support is holding
The neckline of the double top remains unbroken.
Price action shows higher lows forming just below resistance, a bullish sign.
Strategy Outlook: Contrarian Reversal Play
While the double top suggests weakness, the stochastic RSI indicates a rebound. Traders may be witnessing a bear trap, where the market tempts sellers before reversing higher.
If the price moves above both the 50 EMA and 200 EMA on the 4-hour chart, it could trigger what some i call a rocket booster setup —strong upside momentum backed by moving average alignment.
A bullish confirmation candle with volume could solidify the reversal case.
Conclusion
Meta’s chart pattern might look bearish at first glance, but momentum indicators tell a different story. A reversal from here could lead to a breakout if bulls step in with strong follow-through.
Disclaimer: Trading is risky. Use a simulation trading account before you trade with real money and learn risk management and profit-taking strategies.
---
FB2A trade ideas

META at the Pivot Zone: Big Options Energy Building Ahead of CPIGEX-Based Options Analysis:
META is currently trading at $720.70, right beneath the highest positive GEX wall at $725, which aligns with the Gamma Resistance zone. The call structure above is dense, with strong walls at 730, 735, and 740, suggesting sellers may be active on strength unless price can break through and hold above $725. This zone is the inflection.
Below, Put Support builds at 715, 710, and especially at 707.5, forming a defensive gamma floor. The net gamma delta leans slightly CALL-biased at 12.6%, and IVR at 28.6 signals a relatively low volatility environment. This favors premium-selling strategies or debit spreads with strong directional confluence.
💡 Option Trade Setup Ideas:
* Bullish: Above $725 with confirmation, long 735c or 740c dated 7/12 or 7/19. Safer via debit spreads (e.g., 725/735 call spread) if IV climbs post-CPI.
* Bearish: Rejection below $723 with failed breakout = potential short via 720p or 715p targeting $710–707 area.
* Neutral-to-Range Play: Short strangle 715p/735c if expecting chop until CPI resolution.
1-Hour Chart Technical Analysis:
The price action is forming a compression wedge between descending trendline resistance and a horizontal demand base between 711.80–713.50, which has been defended multiple times. The current structure shows lower highs, but also consistent support with multiple BOS/CHoCH flips, especially along the 715 zone.
A strong reaction candle printed off the demand block after sweeping liquidity on July 8th. Volume is declining, suggesting compression before expansion.
🔍 Key Technical Levels:
* Support: 711.80 → 707.50 (Put wall + SMC demand)
* Resistance: 725 → 730 → 735 (GEX resistance cluster)
The EMA and volume structure hint at accumulation, but buyers need a clear breakout over 725 and retest for confirmation. A break below 711 would signal bearish continuation toward 707 and potentially 700.
My Trading Outlook:
* Bullish above 725: I’ll be looking for breakout + volume confluence for short-term long toward 735–740.
* Bearish below 713: If price loses structure and VWAP shifts downward, I’ll scalp short setups toward 707.50 zone.
* Avoid chasing in mid-zone: Let CPI and market sentiment unfold.
Disclaimer:
This analysis is for educational purposes only and does not constitute financial advice. Trade based on your own risk tolerance and always use proper risk management.

3 Reasons the Meta (META) Double Top Is a Buy Signal3 Reasons the Meta (META) Double Top Is a Buy Signal – Rocket Booster Strategy Explained
Meta Platforms Inc. (META) recently printed what looks like a double top pattern on the 4-hour chart.
Many traders are expecting a reversal. But from my perspective, this setup could actually be a trap for early short-sellers. Here's why.
The overall trend remains bullish. Price is still trading above the 50 EMA and the 200 EMA, which confirms that the long-term and
short-term momentum is still upward. When a double top appears in a strong uptrend but fails to break the neckline, it often
becomes a fakeout. Instead of reversing, the price consolidates, shakes out weak hands, and then breaks higher. This is where my
strategy comes in.
I call it the Rocket Booster Strategy. It works like this:
1. First, the price must be above both the 50 EMA and 200 EMA. This confirms we’re in an active uptrend.
2. Then, if a bearish pattern like a double top appears but the neckline does not break, that’s a sign of a trap.
3. We wait for price to bounce near the neckline or break above the recent top. That’s the ignition point – the rocket is ready to fire.
In this Meta setup, if price holds above the neckline or quickly reclaims the recent high, it becomes a strong buying opportunity.
The pattern fakeout acts like fuel, giving bulls the momentum to push price even higher.
This is a high-probability setup because many traders get caught
in the trap, expecting a sell-off, and their stop-losses become buy fuel for the next rally.
Trade idea:
Entry: near neckline bounce or breakout above second top
Stop loss: below the neckline or under the 50 EMA
Target: new highs and above
Final thoughts:
Don’t fall for surface-level patterns. In strong uptrends, failed double tops are often just launchpads. The Rocket Booster
Strategy helps us spot the fakeout and ride the breakout.
How 3 Simple Conditions Turn a Double Top Into a Buy Signal
Most traders see a double top and expect a reversal. But in strong uptrends, this pattern can fail — and when it does, it often sets up
a high-probability buying opportunity. Traders who use the Rocket Booster Strategy understand how to spot these traps and trade them in the direction of the trend.
Here’s how the strategy works — and why some double tops become launchpads, not ceilings.
1. Price Above Both 50 EMA and 200 EMA
When price remains above the 50 EMA and 200 EMA, it confirms strong bullish momentum in both the short and long term. In
these conditions, many reversal patterns like the double top often fail. Instead of selling off, price consolidates and continues higher.
Traders using this strategy only look for buy setups when both EMAs are pointing up and price stays above them.
2. Bear Trap Setup
A double top often attracts sellers. These traders place their stop-losses just above the highs. If price fails to break the neckline and
instead rallies above the top, those stop-losses are triggered, creating a surge in buy orders. This becomes a trap — not a
reversal — and the breakout can be fast and aggressive. The Rocket Booster Strategy takes advantage of this liquidity burst.
3. Entry After Confirmation, Not Assumption
Instead of shorting the pattern, traders using the Rocket Booster Strategy wait for one of two bullish confirmations:
A bounce off the neckline without breaking below it
A breakout above the second top after the trap is set
At that point, the trend is considered intact, and momentum is ready to continue. The "rocket" is refueled, and the strategy shifts
into entry mode.
Trade Setup Example:
Entry: Near neckline bounce or breakout above second top
Stop Loss: Below neckline or under the 50 EMA
Target: New highs and above the pattern top
Final Thoughts
In strong trends, failed double tops are not warning signs — they’re opportunities. The Rocket Booster Strategy filters out weak signals by requiring clear alignment:
price above both EMAs, pattern failure, and bullish confirmation. When these conditions align, a pattern that looks bearish on the surface becomes a fuel source for the next breakout.
Disclaimer: This article is for educational purposes only and not financial advice. Always do your own research.

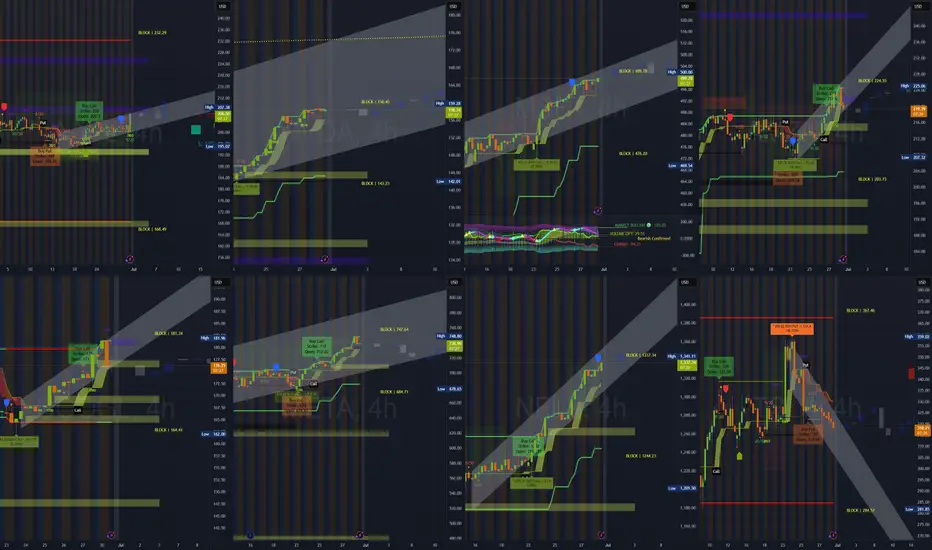
NVDA, AMZN, META AND NFLX 4HS CHARTNASDAQ:NVDA SUP: 157 | RES: 159.7 – Triangle forming.
NASDAQ:AMZN SUP: 220 | RES: 224 – Compression zone.
NASDAQ:META SUP: 700 | RES: 739 – Needs reclaim to recover.
NASDAQ:NFLX SUP: 1279 | RES: 1302 – Bullish dip hold.
#trading #stocks #technicalanalysis #optionsflow #NVDA #AMZN #META #NFLX

$META Braces for Market HeadwindsWhile the NASDAQ is flirting with putting a double-top in, technology companies like NASDAQ:MSFT NASDAQ:GOOGL and NASDAQ:META are increasing CapEx spend for future Ai infrastructure. Margin compression is likely to result with a smaller hit from energy costs - estimated at about 1% of revenue - as energy demand for compute continues to leap forward and future executive action from the Trump administration threatens to kneecap the ITC with modified "placed-in-service" dates and onerous FEOC requirements, eliminating targeted tax subsidies on solar and redistributing the costs to energy more broadly. NASDAQ:META will not likely see the benefits of its CapEx spend anytime soon.
The ratio continues to widen between the NASDAQ:NDX and AMEX:SPY , indicating a higher probability of mean-reverting behavior. While QE and open-market operations have tended to be steepening for technology companies after the dotcom bust and beginning during the GFC, the segment is likely exhausted. We have not yet seen a larger retrace since unprecedented yield inversions starting in '22.
If we see a large market correction, a markdown in share price and any drop in advertising - META's largest revenue driver - will likely compound bearish sentiment. Tariff effects have yet to reported meaningfully in economic data and the job market is cooling. Inflation is likely to stick at 3%. Stagflation is on the table.
What a time to be alive.
~s

META Approaching Key Support – Healthy Pullback Setup?Meta (META) has been climbing within a rising wedge channel since April, recently stalling below $730. A potential short-term pullback is forming, which may offer a healthy reset for momentum indicators.
Price Action:
After tagging the top of the rising wedge, META is showing signs of weakness with a bearish candle and declining volume. Price closed at $715.81 (-1.58%), sitting just above a key support zone.
Support & Resistance:
Resistance: $726 (BB top), $740 (horizontal supply), $772.91 (upper BB 53 band)
Support: $714 (minor), $682–683 (strong horizontal + prior resistance turned support), $637 (EMA 100)
Indicators:
MACD: Still bullish but flattening, signaling slowing momentum.
RSI: 62.21 – cooling from overbought territory.
Volume: Lower on recent candles, suggesting reduced buyer strength.
Key Insight:
A pullback toward the $680 support zone would be healthy and could allow the RSI, MACD, and volume to reset from overextended levels. This would prepare META for a stronger continuation if demand steps back in.
Outlook:
META remains in a bullish structure, but short-term cooling is likely. A bounce from $682 or a breakout above $740 (with volume confirmation) could mark the next directional move. Keep an eye on the earnings date (July 28) for volatility.

META Shares Signal Major Reversal Risk Amid Potential 2B Top PatThe shares of META, the NASDAQ-listed owner of Facebook, recently reached overbought levels as the stock price rose above its upper Bollinger Band and its Relative Strength Index climbed above 70. This suggests that META is likely to enter a period of sideways consolidation or perhaps experience a sharp decline.
However, traders should also pay close attention to a potentially larger reversal pattern known as a 2B top, which may currently be forming.
A 2B top is similar to a double top pattern, but typically the second high slightly exceeds the prior high before reversing. In this case, the high on 30 June 2025 exceeded the previous high set on 14 February 2025. The stock then fell sharply on 1 July, and if it continues to decline below support at $700, this would confirm the 2B topping reversal pattern.
Additionally, a break below support at $700 would signal the end of the uptrend that began on 1 May and also push the price below the 10-day exponential moving average, further confirming a trend reversal.
A decline below $700 could see the shares fall significantly, potentially erasing much of the gains recorded following the US-China trade negotiations held in Switzerland on May 12.
Notably, a price gap exists at $593, created by the announcement following those talks.
Alternatively, if the stock holds support at $700 and continues the uptrend, the 2b top is invalidated, and traders should look for even higher prices from this AI giant. The nice thing about the 2b topping pattern is that it provides an easy-to-identify invalidation price, which in this case would be above $748.
Written by Michael J. Kramer, founder of Mott Capital Management.
Disclaimer: CMC Markets is an execution-only service provider. The material (whether or not it states any opinions) is for general information purposes only and does not take into account your personal circumstances or objectives. Nothing in this material is (or should be considered to be) financial, investment or other advice on which reliance should be placed.
No opinion given in the material constitutes a recommendation by CMC Markets or the author that any particular investment, security, transaction, or investment strategy is suitable for any specific person. The material has not been prepared in accordance with legal requirements designed to promote the independence of investment research. Although we are not specifically prevented from dealing before providing this material, we do not seek to take advantage of the material prior to its dissemination.

$META Chart updateNASDAQ:META just took out ATHs here's an update on my path tp $750, and possibily higher.

WEEK OF 4TH JULYStrongest bullish setups: NVDA, AMZN, TSLA
Watch for pullbacks: META (risk of lower lows), NFLX (overextended)
Key upside targets:
AAPL: $221
NVDA: $199
AMZN: $225
TSLA: $764
GOOGL: $190
MSFT: $450
Support zones to hold: META ($500), AAPL ($200), TSLA ($720)

META-LOOKS STONGNASDAQ:META This is how I see the stock movement.
The setup looks strong, and after a minor correction, I expect the uptrend to continue. I’ve drawn my vision directly on the chart. Let’s see how the market reacts.

META Monday Play: Coiling Under $735 – Breakout or Breakdown?🧠 GEX-Based Options Sentiment:
META is currently hovering right under a dense gamma cluster. The $735–$740 range includes the highest positive GEX level, the CALL wall, and a major resistance zone. Bulls will need strong momentum to break through this level.
The key gamma magnet below is around $722–$720, where GEX6 and GEX8 levels cluster. Below that, the $697.50 HVL and $690 zone offer strong gamma support. If the price unwinds, it could fall quickly through this air pocket.
IVR is sitting at 13.1, which is relatively low, and options are cheap. This favors buying directional premium, especially since calls are showing a high 10.3% flow bias — a sign that traders are still leaning bullish, but that can unwind fast.
🔧 Options Setup for Monday–Wednesday:
Bullish Setup:
If META can break and hold above $735, this opens the door to a push toward $740 and possibly $749. Consider a CALL debit spread, such as 735c/745c for July 3 or July 5 expiration.
Exit if price fails to hold $731.
Bearish Setup:
If META fails to hold $731 and confirms below $726, there’s high probability of a gamma-driven fade into $722 and then $717 or $705.
Consider 725p or 720p with July 3 expiry. Stop-loss on this idea is above $735 reclaim.
📉 Intraday Technical Breakdown (1H Chart):
META is flashing warning signs.
We’ve had a BOS earlier in the rally, but now we’ve seen a CHoCH beneath the rising wedge structure. Friday’s session ended with price stalling at the supply zone around $733–$735, unable to break the trendline overhead.
Volume is dropping, and we may be witnessing early distribution before the holiday week. Price is sitting on the edge of a decision zone — break above and squeeze, or roll over and fade.
📌 Key Intraday Levels:
$735 – Immediate overhead resistance (GEX + Supply zone)
$740 – Gamma extension / 3rd CALL Wall — breakout target if bulls take over
$726 – CHoCH / structure support
$720 – Gamma magnet zone
$705–703 – Final demand support from BOS base
$697.50 – HVL zone and gamma reversal area
$678 – Last line of defense before major unwinding
✅ Thoughts and Monday Game Plan:
META is compressing beneath a heavy resistance cluster. The options market is pricing for a possible breakout, but the technicals show a potential trap if bulls don’t follow through quickly. A clean break above $735 with volume could send META to $740+ by Tuesday. But a failed breakout or rejection back under $726 could lead to a swift fade toward $705–$697 zone.
Patience is key. Let Monday’s opening hour set the tone — don’t rush in. Fade weak breakouts, and favor direction once price confirms above or below the gamma bands.
Disclaimer:
This breakdown is for educational purposes only and not financial advice. Trade your plan, not your emotions. Always manage risk.

$META - channel breakout and test of all time highs incomingMETA - Stock breaking out of the channel on the daily time frame. Stock is approaching all time highs at $739.68. We might see a possible retest those levels very soon. calls above $727 looking good.

META: Short From Resistance! SELL!
META
- Classic bearish resistance pullback
- Our team expects a move down
SUGGESTED TRADE:
Swing Trade
Sell META
Entry Level - 708.68
Sl - 742.00
Tp - 667.90
Our Risk - 1%
Start protection of your profits from lower levels
Disclosure: I am part of Trade Nation's Influencer program and receive a monthly fee for using their TradingView charts in my analysis.
❤️ Please, support our work with like & comment! ❤️

META is Heating Up! Time to Ride the Gamma Wave? 🔥 GEX Insight – Institutional Positioning:
META’s GEX chart is showing strong bullish sentiment:
* 📈 Highest Net GEX / Call Wall at $710, with stacked call resistance up to $740+.
* ✅ Current price at $712.10 has already pushed into the upper gamma zone — this puts $725 and $732.5 in play.
* 🟩 IVR at 5.5 + IVX dropping = low implied volatility zone — perfect time to buy calls cheap before volatility expansion.
* 🟢 GEX boxes: Full green lineup = highly supportive environment for bullish flow.
Options Idea:
🎯 Buy META 720C 06/28 (Friday expiry)
* Entry under $712.50
* Risk: below $703.00 (invalidates gamma push)
* Target 1: $725
* Target 2: $732.50 (GEX wall)
Why it works: You're riding on gamma exposure, a fresh breakout, and institutional positioning behind you.
Chart-Based Trading Plan (1H Structure):
META just broke above a long consolidation zone with:
* 🔄 Clean CHoCH → BOS → CHoCH bullish market structure.
* 🔼 Price retested the OB at ~$703–705, then bounced hard, forming a bull flag.
* ⛽ Volume spike and consolidation just below resistance at $715, with clear path toward the next SMC target at $740.
Trade Scenario:
* 📈 Bullish Play:
* Entry: Break above $713.00 (flag breakout)
* Target: $725, then $732.50
* Stop-Loss: Below $703 (last demand and CHoCH)
* 🧘♀️ Conservative Entry: Wait for pullback to $707–708 area (OB support), enter calls on bounce with tighter risk.
Wrap-up:
META’s GEX flow and technical structure are aligned for a potential continuation higher. You’ve got institutions buying calls into low IV, and price holding structure above BOS and CHoCH. Great odds for a momentum play to the upside — just don’t chase too high without a plan.
Disclaimer: This is not financial advice. Trade at your own risk with proper sizing and a risk management plan.

Meta Platforms - This stock tastes sooo good!Meta Platforms - NASDAQ:META - will print a new all time high:
(click chart above to see the in depth analysis👆🏻)
Over the course of the past two months, Meta has been rallying +40%. This recent behaviour was not unexpected at all but rather the consequence of the all time high break and retest. Now - back at the previous all time high - Meta will most likely break out higher again.
Levels to watch: $700, $900
Keep your long term vision!
Philip (BasicTrading)

META an opportunity to add on this dip
Traded from that flag consolidation and was able to make some money on it.
now NASDAQ:META looks like a double top on the daily
but very bullish chart and can be added back between 660-665
that's it

$META - Consolidation Cluster Bullish Flagging Ahead of The FedPrice held above key levels after breakout and is now flagging near highs.
700+ zone holding as new support
Strong structure with rising 9EMA catch
Volume cooling, but MACD remains bullish
Eyeing potential expansion above $708–710 range
This setup favors continuation. Watching for a clean break and close above $708 to confirm next leg higher.

Meta Platforms - The rally is clearly not over!Meta Platforms - NASDAQ:META - can rally another +30%:
(click chart above to see the in depth analysis👆🏻)
Some people might say that it seem counterintuitive to predict another +30% rally on Meta Platforms while the stock has been rallying already about +750% over the past couple of months. But price action and market structure both tell us, that this will soon turn into reality.
Levels to watch: $850
Keep your long term vision!
Philip (BasicTrading)

META June 2025 Monthly Support & Resistance Lines Valid till EOMOverview:
The purple lines serve as support and resistance levels for META stock throughout the month of June. When the price approaches these lines from either the bottom or the top, I will consider taking long or short positions in META stock, depending on the direction of the price movement.
Trading Timeframes
I usually use 30-minute candlesticks to swing trade options by holding 2-3 days max. Some can also use 3hr or 4hrs to do 2 weeks max swing trades for massive up or down movements.
I post these 1st week of every month and they are valid till the end of the month.

where were you 10 years ago, Facebook/Meta ?$10,000 Invested for 10 Years
Meta price March 19, 2015: $82.36
Meta 10-year return: 609.15%
S&P 500 price March 19, 2015: $2,089.27
S&P 500 10-year return: 171.64%
Nasdaq price March 19, 2015: $4,992.38
Nasdaq 10-year return: 255.56%
For more on the returns, read here
The consolation is IF you can't pick stock and hold it long enough to see the enormous returns, then investing in the index is the next best thing to do. You still get about 1/3 of the returns if you invest in Nasdaq compared to investing directly with Meta.
Of course, it has its down time as well as indicated in the orange loop. Question is were you able to ride the downs before enjoying the ups? Or you freak out and sold your shares like what some doomsday porn were influencing you?
And please don't ask me if Meta will ever by replaced ? How the hell will I know ? Go ask 3 of your good friends and 3 of your colleagues are they using FB, whatsapp and instagram? Just one or all 3 ? How often do they check their messages or go post on it ?
The answer is pretty clear.........

META: Close to a 1D Golden Cross. Strong buy.META is almost overbought on its 1D technical outlook (RSI = 69.797, MACD = 30.360, ADX = 40.237) but is about to form a 1D Golden Cross, the first such pattern since March 1st 2023, which was a little after the November 2022 market bottom. The market technically thrives on such conditions and since 2019, the 3 Golden Cross patterns that were formed were bullish continuation formations. Based on the 1W RSI, the current Golden Cross might be more similar with the June 2nd 2020 Golden Cross that was formed after the COVID crash. It rose by +123.42% before pulling back to the 1D MA200 again, so we remain bullish on META with TP = 1,000.
## If you like our free content follow our profile to get more daily ideas. ##
## Comments and likes are greatly appreciated. ##

Don’t Sleep on META Buy the Fear, Ride the AI Wave After an impressive run, META is taking a breather around $700. But let’s not forget—this stock was trading at $530 just a few months ago. With aggressive AI bets like the $14.8B stake in Scale AI and plans to develop superintelligent models, Meta isn’t just following the AI trend—it wants to lead it.
Now here's the setup:
We could see a healthy pullback before the next leg higher. The $620–$650 zone looks like a magnet if broader tech cools off short-term.
🔽 Entry Points (Dip Buy Zone)
⚡ $700 (speculative starter)
⚡ $665–650 (ideal swing entry)
⚡ $620 (major opportunity zone if fear takes over)
📈 Targets
🎯 TP1: $725
🎯 TP2: $805 – breakout into blue-sky territory
🎯 TP3: $850+ – long-term growth if AI hype turns into revenue reality
🧠
META’s AI investments and platform dominance are building real momentum. Volatility may offer the perfect second chance. Risk is real but so is the upside.
⚠️ Disclaimer: This is not financial advice. Do your own research before making any investment decisions. Markets are risky, trade responsibly.
