CRM - July 28 to Aug 4,2022 - Supertrend signals "Buy" on July 27,2022 on the 15 Min Chart.
- 50 Day crosses 200 Day EMA on July 28,2022.
Entry Price - 1000 @ $181.08
Stop Loss - $174.34
Target Price (1.5:1) - $191.21
- SOLD on Aug 4, 2022 - 500 @ $191.24
= +$5,080.00
FOO trade ideas

Bottoming Patterns with Rising LowsThis bottoming pattern shows retests of the lows and how, over time, the lows of the retests start to rise. This tends to be a footprint of Dark Pools quietly accumulating over time.
CRM has recently added Artificial Intelligence to its software to promote and sell more of its customer management software solutions to mid-sized businesses.

crm 2 scenarioscrm 2 scenarios .. 1]buy after the break above the resistance 1 and 200ma .. 2] sell after the break under the support 1 and 50ma ..

CRM - Bullish Divergence on MonthlyCRM hit a low of 154 in late May, a 78.6% fibonacci retracement of it's major AB swing up.
It then traded sideways in the past 2 months, forming a symmetrical triangle.
With bullish divergence seen on it's monthly chart, it looks like the odds of a breakup is likely and when this happens, it is probably a good time to ride the trend.
Disclaimer: Just my 2 cents and not a trade advice. Kindly do your own due diligence and trade according to your own risk tolerance and don't forget that money management is important! Take care and Good Luck!

Symmetrical TriangleNeutral pattern until a trendline is broken.
Targets for a break down in orange with smaller type being T2 if T1 is passed.
Entry short (ES) is 158.15.
Targets for a long entry above triangle.
No recommendation.
Short interest is less than 1%
Earnings estimated to be 8-24

CRM - are you catching a falling knife ?It is really more of luck than skills to pick the bottom for any stock ! The price action has shown us that the 3 red candles that could not break above the resistance level at 193 means selling is still strong........
It is likely to revisit support level 1 at 158.96. Here, we might see some rebound but it has to break above 193.85 to sustain the rally else it is going to fall further south towards 125.61 support level.
So, for those keen to long this stock, you can buy in tranches at support level 1 and more at support level 2 rather than go all in at this juncture.


CRM Gap Filled The market has been having a brutal past few days so this trade carries a bit more risk but the alert fired today for a buy so going to stick with my system.
After posting a really solid ER a few weeks back CRM gapped up. I'm long term bullish on software that provides core services to businesses. I think even with a recession it's going to be tough for business to be able to pivot away from services that are tightly integrated into their workflow.
CRM Guru Focus Stats:
GF Score 88/100
GF Value Rank 8/10
GF Value: 269.82 Significantly Undervalued
CRM hasn't popped up on my screener just yet so I'm cautious on this buy and don't plan on making this a large holding. I purchased 2 shares with the intent of selling one if we receive a bounce on the gap fill. It's also come down nicely to a .618 fib from the most recent low to high.
Current Positions:
1 SPY 398.16 CB
2 CRM 167.78 CB
You can also follow along with my TraderSync public profile
Affiliate Link: TraderSync Affiliate

CRM ShortIn big downtrend, bounce back to resistance
Earning 8/31/2022 Estimate 1.04
Short 184
Stop 194
Target 130
Risk management is much more important than a good entry point.
I am not a PRO trader.
In my trading plan, the Max Risk of each short term trade should be less than 1% of an account.

CRM to resume down trendEarnings somehow surprised wall street with a mixed Q1. The PE of 175 is a bargain compared to competitor NOW, likely more of relief rally. Near-term overbought on couple indicators

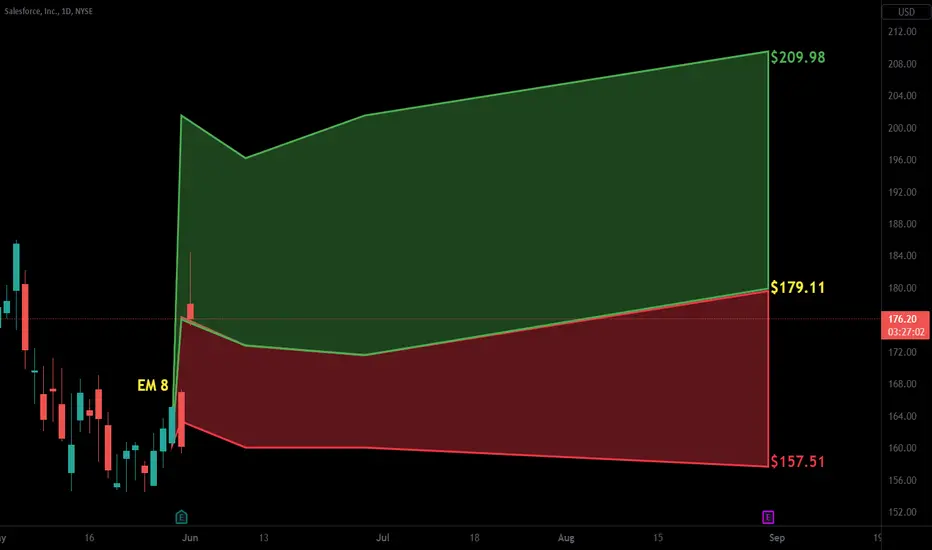
May the force (sales) be with youSaleforce
Short Term - We look to Buy a break of 192.11 (stop at 179.00)
Although the bears are in control, the stalling negative momentum indicates a turnaround is possible. This stock has recently been in the news headlines. A bullish reverse Head and Shoulders is forming. A break of yesterdays high would confirm bullish momentum. We look for gains to be extended today.
Our profit targets will be 232.75 and 240.00
Resistance: 190 / 224.00 / 260.00
Support: 168.00 / 140.00 / 115.00
Disclaimer – Saxo Bank Group. Please be reminded – you alone are responsible for your trading – both gains and losses. There is a very high degree of risk involved in trading. The technical analysis, like any and all indicators, strategies, columns, articles and other features accessible on/though this site (including those from Signal Centre) are for informational purposes only and should not be construed as investment advice by you. Such technical analysis are believed to be obtained from sources believed to be reliable, but not warrant their respective completeness or accuracy, or warrant any results from the use of the information. Your use of the technical analysis, as would also your use of any and all mentioned indicators, strategies, columns, articles and all other features, is entirely at your own risk and it is your sole responsibility to evaluate the accuracy, completeness and usefulness (including suitability) of the information. You should assess the risk of any trade with your financial adviser and make your own independent decision(s) regarding any tradable products which may be the subject matter of the technical analysis or any of the said indicators, strategies, columns, articles and all other features.
Please also be reminded that if despite the above, any of the said technical analysis (or any of the said indicators, strategies, columns, articles and other features accessible on/through this site) is found to be advisory or a recommendation; and not merely informational in nature, the same is in any event provided with the intention of being for general circulation and availability only. As such it is not intended to and does not form part of any offer or recommendation directed at you specifically, or have any regard to the investment objectives, financial situation or needs of yourself or any other specific person. Before committing to a trade or investment therefore, please seek advice from a financial or other professional adviser regarding the suitability of the product for you and (where available) read the relevant product offer/description documents, including the risk disclosures. If you do not wish to seek such financial advice, please still exercise your mind and consider carefully whether the product is suitable for you because you alone remain responsible for your trading – both gains and losses.

$CRM - long to 192 ish areaIf drops below Level 173.33 then open with stop at 173.43 - target 192.30
Enter at 181.51, set stop to 179.86 and target is $192.30
Once we hold 192.30 area, target is 204.49
Keep in mind the gap to fill between 166.13 and 173.33
This is very short term trading... scalping or swing

CRM False Breakout. Incoming Retest of Recent Lows. CRM's breakout of its medium term downward channel looks pretty weak. Volume is slowing, while weekly and monthly timeframes are signaling strong negative momentum. The trend for CRM (at least in the intermediate term) is downward. I'm calling for a move down to the recent low of 154.60. Most likely there will be lower lows formed after this retest for CRM but we will have to wait and see.
This is not trading advice. Good luck!

$CRM with a Bullish outlook following its earnings #Stocks The PEAD projected a Bullish outlook for $CRM after a Negative over reaction following its earnings release placing the stock in drift A with an expected accuracy of 60%.
CRM: Its not all doom and gloom!!Saleforce
Short Term - We look to Buy at 168.45 (stop at 151.44)
They reported earnings with forecasted earnings rising despite strong dollar headwinds. This led to a jump in premarket and could provide impetus for further rise up. There is scope for mild selling at the opening but loses should be limited. Our outlook is bullish. Dip buying offers good risk/reward.
Our profit targets will be 222.00 and 240.00
Resistance: 185.75 / 224.00 / 260.00
Support: 168.00 / 140.00 / 115.00
Please be advised that the information presented on TradingView is provided to Vantage (‘Vantage Global Limited’, ‘we’) by a third-party provider (‘Signal Centre’) . Please be reminded that you are solely responsible for the trading decisions on your account. There is a very high degree of risk involved in trading. Any information and/or content is intended entirely for research, educational and informational purposes only and does not constitute investment or consultation advice or investment strategy. The information is not tailored to the investment needs of any specific person and therefore does not involve a consideration of any of the investment objectives, financial situation or needs of any viewer that may receive it. Kindly also note that past performance is not a reliable indicator of future results. Actual results may differ materially from those anticipated in forward-looking or past performance statements. We assume no liability as to the accuracy or completeness of any of the information and/or content provided herein and the Company cannot be held responsible for any omission, mistake nor for any loss or damage including without limitation to any loss of profit which may arise from reliance on any information supplied by Signal Centre.

SALESFORCE-BULLISH SCENARIOA strong weekly support level crossed by the 0.618 Fibonacci level was reached by Salesforce, providing us a good entry point for a long-term trade
CRM will be reporting its fiscal 2023, first-quarter earnings on Tuesday, May 31 after the market closes. It is forecast to report $7.38 billion in revenue and $0.94 of earnings per share.
So far, the company which sells enterprise software and cloud-based services has never released disappointing financial results.
Risk Disclosure: Trading Foreign Exchange (Forex) and Contracts of Difference (CFD's) carries a high level of risk. By registering and signing up, any client affirms their understanding of their own personal accountability for all transactions performed within their account and recognizes the risks associated with trading on such markets and on such sites. Furthermore, one understands that the company carries zero influence over transactions, markets, and trading signals, therefore, cannot be held liable nor guarantee any profits or losses.

SalesForce (NYSE: $CRM) Wicks Under The 0.786 Fibs! 🕯️Salesforce, Inc. provides customer relationship management technology that brings companies and customers together worldwide. Its Customer 360 platform empowers its customers to work together to deliver connected experiences for their customers. The company's service offerings include Sales to store data, monitor leads and progress, forecast opportunities, gain insights through analytics and relationship intelligence, and deliver quotes, contracts, and invoices; and Service that enables companies to deliver trusted and highly personalized customer service and support at scale. Its service offerings also comprise flexible platform that enables companies of various sizes, locations, and industries to build business apps to bring them closer to their customers with drag-and-drop tools; online learning platform that allows anyone to learn in-demand Salesforce skills; and Slack, a system of engagement. In addition, the company's service offerings include Marketing offering that enables companies to plan, personalize, and optimize one-to-one customer marketing journeys; and Commerce offering, which empowers brands to unify the customer experience across mobile, web, social, and store commerce points. Further, its service offerings comprise Tableau, an end-to-end analytics solution serving various enterprise use cases; and MuleSoft, an integration offering that allows its customers to unlock data across their enterprise. The company provides its service offering for customers in financial services, healthcare and life sciences, manufacturing, and other industries. It also offers professional services; and in-person and online courses to certify its customers and partners on architecting, administering, deploying, and developing its service offerings. The company provides its services through direct sales; and consulting firms, systems integrators, and other partners. Salesforce, Inc. was incorporated in 1999 and is headquartered in San Francisco, California.

$CRM a favorite tech play$CRM has strong fundamentals and has currently slightly undercut its bottom trend after overshooting on the previous rally. Along with being at the bottom of its trend at a strong price volume support area I believe this is one of the best secure growth/value plays out there. $CRM has a very sticky customer base and is growing at a rapid rate. While on the surface they look expensive at a 111PE ratio this is an illusion since like Amazon in the early days they reinvest their profits to avoid large tax burdens and to fuel growth. eg. in the last year their net income was only 1.44 billion but spend about 11 billion on sales and marketing. If you look at their profitability before the reinvestment into marketing they are trading near a 15 PE ratio.
From some rough projections I have I think it would be reasonable for them to reach a $100 billion revenue by 2030 and could likely achieve a net margin of 25-30% which could give their a value of at least a $500 billion market cap at around a 17PE.

Head and Shoulders/Bear Flags CRM has fallen past the 100% mark for the head and shoulders top.
Price was hanging on to the support line of another bear flag for a few days. Today is a bloody day in the market and price has broken the support line of the flag. A bear flag can break to the upside or the downside, so until the support line of the bear flag is broken with a down trend, it is not a valid flag. Folks measure targets in different ways, but I measure the pole and project it downward from the top trendline of the flag which would take price to the 1.272 fib level of the H&S pattern.
I looked at this on weekly and it looks like a Cypher or a Shark, M shaped pattern with peak 2 higher than peak 1, so this would be a bullish M when the final leg lands. The retracement leg, or leg 2, lands at the 0.5 which for me, does not rule either of these patterns out. The cypher's 2nd leg must land between the .382 and the .618 and the shark has no rule on the retracement leg except it can not go below 0. The shark is labeled OXABC and the Cypher is labeled XABCD. The Cypher should land close to the .786 of XC and the 2nd peak is labeled C. The Shark should land close to the .886 of OX, or the first leg up known as the impulse wave. In some cases the Shark can land at the 1.113 of OX.
I never feel certain when trying to differentiate these 2 patterns from each other unless the retracement had been at the .236 or deeper than .618, and then I know it is a shark. So I measure for both, and wait for price to land! If you know how to tell if a pattern is a Cypher or a Shark if the retracement is between .382 and .618, please post it below.
I did note that the .786 of the entire structure hits the 1.272 of the head and shoulders pattern and the .886 of the impulse wave if this were a shark, would hit the 1.618 of the H&S pattern, so there is confluence at both of these levels. I do not mean to be confusing but there are 2 patterns, the head and shoulders and a harmonic pattern and I am basically saying the levels below line up with each other. The harmonic pattern is easier to see on weekly.
The 1.113 fib level of the head and shoulders pattern has served as support as of late. If price falls below this level, there could be issues.
Time will tell.
Possible targets 1 down in orange type below price. Targets 2 in smaller type if price goes past targets 1.
Short is around 2 percent which is on the low side.
No recommendation.
Weekly chart
www.tradingview.com

Salesforce Inc - Chance for Short Term Pump Before Correction?Salesforce is undoubtedly one of the leaders in the ERP industry and with growing digitalisation of economies the growth is going to continue.
The question is - can the upcoming earnings report convince investors for another bull run to update the current high of £311?
Fundamentally: the company is rapidly growing in revenue but the profits are not quite there yet and it's outrageously overpriced with P/E at 115x.
Technically: looking at the weekly timeframe we can clearly see the impulse structure and the last correction indicates the formation of Extended Flat with 3-3-5 wave sequence. If this is the case then there is a chance for another bull run to a potential target of £311.
Risks - as mentioned earlier P/E is too high at this uncertain time with recession talks on all media channels so it is a risk that the next earnings report may spook the investors and correction will go even deeper.
I am keen to know what your position is on Salesforce .
Please share your thoughts in the comments and like this idea if you would like to see more stocks analysed using Elliott Waves.
Thanks


