CRM looks Promising for BullsCurrent Price of CRM has cleared the 211 resistance area decisively. It's important Bulls to take charge and hold the the price above $219 for its next leg.
Targets for Long above $219 are $ 225, $232, $241,$256,
Stock favors Shorts if price stays below $219 and likely targets would be $211,$209 $204, $200,$197, $189
keep in mind September is the volatile month and CRM moves quickly. Position sizing and stop losses need to be respected.
FOO trade ideas

CRM Salesforce Options Ahead of EarningsIf you haven`t sold CRM here:
or reentered here:
Then analyzing the options chain and the chart patterns of CRM Salesforce prior to the earnings report this week,
I would consider purchasing the 210usd strike price Puts with
an expiration date of 2023-9-15,
for a premium of approximately $8.75.
If these options prove to be profitable prior to the earnings release, I would sell at least half of them.
Looking forward to read your opinion about it.

CRM Entry, Volume, Target, StopEntry: with price above 238.22
Volume: with volume greater than 8.5M
Target: 520.29 area (this is an area, no guarantee it reaches this price, but you should be selling on the way up)
Stop: Depending on your risk tolerance; Based on an entry of 238.23, 230.82 gets you 2/1 Reward to Risk Ratio.
This LONG swing trade idea is not trade advice and is strictly based on my ideas and technical analysis. No due diligence or fundamental analysis was performed while evaluating this trade idea. Do not take this trade based on my idea, do not follow anyone blindly, do your own analysis and due diligence. I am not a professional trader.

$CRMPotential short?
Weekly candles, so give it time to play out. Still have another 2 days left in this current weekly candle, so this is essentially a front run move, but that's why we have stop losses.
If macro markets drop this will obviously follow.
Key fib level at 0.886.

CRM Entry, Volume, Target, StopEntry: when price clears 225.00
Volume: with daily volume greater than 19.63M
Target: 239 area
Stop: Depending on your risk tolerance; 220.35 gets you 3/1 Risk/Reward.
This swing trade idea is not trade advice and is strictly based on my ideas and technical analysis. No due diligence or fundamental analysis was performed while evaluating this trade idea. Do not take this trade based on my idea, do not follow anyone blindly, do your own analysis and due diligence. I am not a professional trader.

CRM - BULLISH RALLYSalesforce stock (CRM) has seen a surge due to a truce with activist investor Elliott Management, the introduction of new AI services, and price increases on key products. The stock gained 5% in July, outperforming the market. CEO Marc Benioff's net worth has risen by $2.5 billion. Salesforce raised prices by an average of 9%, driving positive reactions from analysts. The company's AI Cloud product and upcoming AI tools have also generated excitement. Improved expense control and expectations of higher profit margins contribute to the positive outlook, despite economic uncertainties.
It is fair to say previous highs are near posibility.

Salesforce broke free from a triangle.Salesforce - 30d expiry - We look to Buy at 216.11 (stop at 206.11)
The primary trend remains bullish.
Broken out of the triangle formation to the upside.
Previous resistance at 216 now becomes support.
We look to buy dips.
Intraday dips continue to attract buyers and there is no clear indication that this sequence for trading is coming to an end.
This stock has seen good sales growth.
Our profit targets will be 240.11 and 245.11
Resistance: 225.00 / 230.00 / 235.00
Support: 216.00 / 213.00 / 208.50
Please be advised that the information presented on TradingView is provided to Vantage (‘Vantage Global Limited’, ‘we’) by a third-party provider (‘Everest Fortune Group’). Please be reminded that you are solely responsible for the trading decisions on your account. There is a very high degree of risk involved in trading. Any information and/or content is intended entirely for research, educational and informational purposes only and does not constitute investment or consultation advice or investment strategy. The information is not tailored to the investment needs of any specific person and therefore does not involve a consideration of any of the investment objectives, financial situation or needs of any viewer that may receive it. Kindly also note that past performance is not a reliable indicator of future results. Actual results may differ materially from those anticipated in forward-looking or past performance statements. We assume no liability as to the accuracy or completeness of any of the information and/or content provided herein and the Company cannot be held responsible for any omission, mistake nor for any loss or damage including without limitation to any loss of profit which may arise from reliance on any information supplied by Everest Fortune Group.

CRM put put spread
Macro: Strong SnP and NQ, CRM product price increase
TA: break of small range
entry: break of tight range
TP : at the next swing high or option expire
stop: carry til expiry or roll, if 90% value or reminder value/day<2

CRM breaking out of pennant, or wave C correction?Salesforce ( NYSE:CRM ) is making an impressive pre-market move, poised to kick off the day with a breakout from its pennant formation. By taking into account a measured move from the previous consolidation phase, coupled with a measured move from the onset of the formation, we can project a potential target range of $233-238. Interestingly, this aligns with the consensus 12-month price targets.
We're looking for this to invalidate the possibility that we've just wrapped up a wave B and are now embarking on a wave C correction. If the breakout fails and we enter a wave C hypothesis the long-term target remains intact. Consequently, I've planned two a entry approach: an immediate entry and a subsequent one at the $200 mark for further accumulation.
It's worth noting that both these levels have strong volume support. This dual-entry strategy provides a balanced approach to potential market volatility, ensuring we're prepared for either outcome.

Salesforce ready for downside- CRM has showed rejection off the .5 fib level which can confirm that W2 is over and we are headed for W3. I would like to see price break through support of the blue lines on the chart to confirm even more that we would be inside of a W3.
I would not be a buyer currently at these levels.


Salesforce Has Been SnoozingSalesforce rallied along with other software and growth names between March and May. Is it poised for more upside after a June pause?
The first pattern on today’s chart is the falling trendline along the recent highs. A break of that resistance could make traders expect the uptrend to continue.
Next, CRM has been stuck near the 50 percent retracement of its drop between November 2021 and December 2022. That’s a natural place for a breather. However other stocks like Tesla and Meta Platforms have continued higher after resting at similar spots.
Third, Bollinger Band Width has narrowed to its tightest range in almost two years. That price compression could be followed by a period of expansion.
Finally, moving averages are still consistent with upward movement in price. CRM has stayed above its 50-day simple moving average (SMA). The 8-day exponential moving average (EMA) has also remained above the 21-day EMA.
TradeStation has, for decades, advanced the trading industry, providing access to stocks, options, futures and cryptocurrencies. See our Overview for more.
Important Information
TradeStation Securities, Inc., TradeStation Crypto, Inc., and TradeStation Technologies, Inc. are each wholly owned subsidiaries of TradeStation Group, Inc., all operating, and providing products and services, under the TradeStation brand and trademark. TradeStation Crypto, Inc. offers to self-directed investors and traders cryptocurrency brokerage services. It is neither licensed with the SEC or the CFTC nor is it a Member of NFA. When applying for, or purchasing, accounts, subscriptions, products, and services, it is important that you know which company you will be dealing with. Please click here for further important information explaining what this means.
This content is for informational and educational purposes only. This is not a recommendation regarding any investment or investment strategy. Any opinions expressed herein are those of the author and do not represent the views or opinions of TradeStation or any of its affiliates.
Investing involves risks. Past performance, whether actual or indicated by historical tests of strategies, is no guarantee of future performance or success. There is a possibility that you may sustain a loss equal to or greater than your entire investment regardless of which asset class you trade (equities, options, futures, or digital assets); therefore, you should not invest or risk money that you cannot afford to lose. Before trading any asset class, first read the relevant risk disclosure statements on the Important Documents page, found here: www.tradestation.com .

$CRM with a bullish outlook following its earnings #StocksThe PEAD projected a bullish outlook for NYSE:CRM after a negative over reaction following its earnings release placing the stock in drift C with an expected accuracy of 40%.

CRM: Buy ideaBuy idea on CRM as you see on the chart because we have the breakout with force the vwap indicator. Thanks!

CRM: Sell ideaSell idea on CRM as you see on the chart because we have the breakout with force the support line and the vwap indicator.Thanks!

#CRM straddle detected! Notional value - 1.2M$.A trader who has a STRADDLE will open a long position at a support level or a short position at a resistance level safely.
He will not lose money if the market goes in the opposite direction.
BIG MONEY likes this plan and we can watch them and use support and resistance levels as ways to get in.

CRM squeezing in a ascending triangleCRM has been pumping upwards with close to no pullbacks. CRM now squeezing in the ascending triangle. Will it break upwards and continue the upward trend?

CRMlooking to break above 222
there are some ai related news
as long as the price is following the channel the momentum is bullish

CRM long running Bullish channelCRM has been runnning a very long term Bullish reversal pattern
If we take previous High of 306 as the base of Fib retracement then we are right at the golden fib pocket which is confirming a bullish reversal
After last good earnings it made a high of 224 and then made a low of 205 .
Right now its in kind of a accumulating mode where 205 is being tested multiple times.
As per the trend we are at the bottom of the channel and there can be a potential breakout
Entry @ 205-209 area
TP1 @ 224
TP2 @237
SL @ 197

Watch very closePrice is sitting on an important area of support. I'll wait for a clear break down before load myself with puts. The other option is to wait for a push back of the support area and then short before it tries again to break it. I'll keep you posted.

Rising WedgeThe bottom line of the rising wedge has been broken so it is now valid.
Price can fall to the bottom of where the wedge formed or depending on the market, it can fall even lower. Price can also stop falling when it hits a support level within the wedge.
The more candle touches a support line has, it comes a stronger support level. The more touches a resistance line has, makes it a stronger level of resistance.
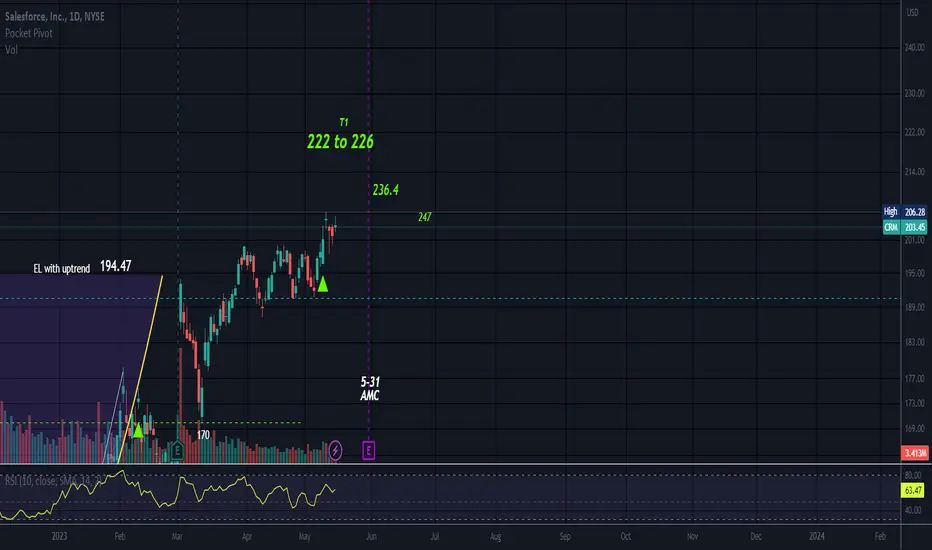
Target 1 of the cup and handle was met and sometimes all we get is T1.
No recommendation.

Cup and HandleThis has broken long entry level of 197.47.
Any pattern can fail especially Cups as of late.
I suppose market chop is hard on a cup and handle pattern.
NO recommendation
CRM Salesforce Options Ahead of EarningsIf you haven`t sold CRM here:
then Analyzing the options chain of CRM Salesforce prior to the earnings report this week,
I would consider purchasing the 230usd strike price Calls with
an expiration date of 2023-9-15,
for a premium of approximately $9.05
If these options prove to be profitable prior to the earnings release, I would sell at least half of them.
Looking forward to read your opinion about it.
