HSBC Testing Resistance, Potential Reversal!HSBC is testing its resistance where a reversal could occur. Stochastic is approaching its resistance as well where a corresponding reversal could occur.
HBC1 trade ideas
HSBC Approaching Resistance, Potential Reversal!HSBC is approaching resistance where a reversal could occur.
Stochastic is approaching resistance as well.

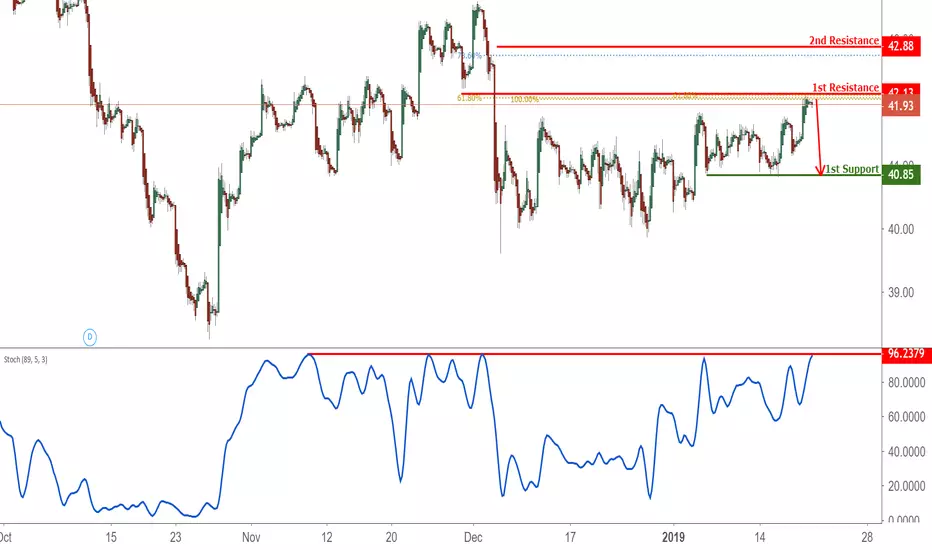
HSBC Approaching Resistance, Potential Reversal!HSBC is approaching its resistance at 42.27 (100% Fibonacci extension, 61.8% Fibonacci retracement, horizontal overlap resistance) where it is expected to reverse down to its support at 40.07 (horizontal swing low support).
Stochastic (89, 5, 3) is approaching its resistance at 96% where a corresponding reversal is expected.

HSBC Bounced Off its Support, Potential Rise!HSBC bounced nicely off its support at 40.07 (100% Fibonacci extension, 61.8% Fibonacci retracement, horizontal swing low support) where it could potentially bounce to its resistance at 41.94 (61.8% Fibonacci retracement, horizontal swing high resistance).
Stochastic (55, 5, 3) has bounced off its support ascending support line.

HSBC Bounced Off Support, Potential Further Rise!HSBC bounced off its support at 36.98 (61.8% Fibonacci extension, 61.8% Fibonacci retracement, horizontal overlap support) where it could potentially rise to its resistance at 46.16 (50% Fibonacci retracement, horizontal pullback resistance).
Stochastic (89, 5, 3) has bounced off its support at 2.4% where a corresponding rise could occur.

HSBC HOLDINGS - NYSE - xuanhaimmoerAll analysis in the chart, you guys can read and refer it to make an oder and entry!
Good luck for all guys! Thanks you and dont forget LIKE if you interesting with this!

HSBC plc - 2 bullish countsA couple of bullish counts here although one of them thinks that it may sink a bit lower yet before turning up again.

chart has all the bullish componets $fxi IHS, cup/handle, solid hold after ab-cd, see a bullish c-wave set up

38.2% & POSSIBLE 61.8% Retracement LONG GWAVE38.2% & POSSIBLE 61.8% Retracement LONG GWAVE.
FIB Retracement Percentage is calculated in a Higher Euclidean Dimension.
PLEASE ALWAYS WAIT FOR STOCHASTIC CONFIRMATION!!! THANKS

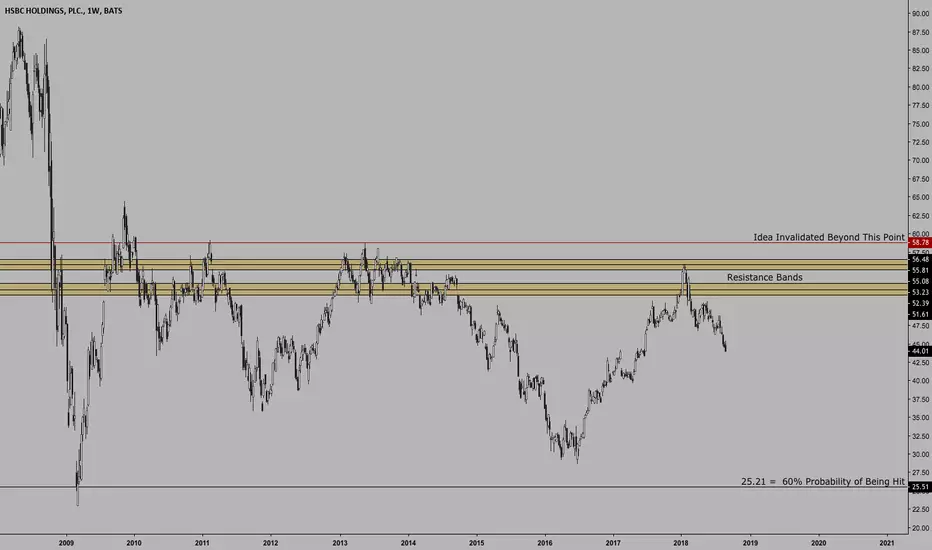
$HSBC | Multi-Year Consolidation | Targeting Near 10-Year LowHello Traders,
HSBC has been in a large consolidation since the Financial Crisis of 2008. Based on my model, this is still 60% probability that 25.21 will be hit before this Multi-Year Consolidation is over. There have been two sell signals both pointing to the same target of 25.21 from my model, therefore, this chart is worthy of a share.

HSBC at the Good Buy ZoneOversold, good buy zone. I'm waiting for the confirmation.
Entry: 45.02
Stop Loss: around 44
Desire Exit: around 47
Hold for 1 week
Percentage of Profit: 6%
Percentage of Loss: 1.33%


HSBC LONG-LONG-LONGHSBC securities trades at $50.18.
We are going to buy it after bell as we have and fundamental both technical arguments to wait for holding $52.45. Thus we have fixed stop lose at the price $49.26. It has just give us our new trading strategy which called Trend Line by Kagor Invest.
Follow us for earning more then ever


#HSBC is now below its 200EMAHSBC is now below its 200 EMA
It still has to break 705 though and horizontal resistance will be stronger.
Also it's weekly chart is still in an uptrend.
Wait and see.


HSBC - break out of long term trend linesHSBC broke through 2 long term trend lines today which might suggest some bullishness going forward. Also worth noting is history has shown that as goes HSBC the FTSE 100 usually follows. I have left any EW wave count off the chart as I am still undecided if this is all part of a long term correction dating from the top in 2001 or part of an impulsive climb that began in 2009. Whichever way I look at it, I reckon there is still some upside in this stock.


HSBC based on technical analysis of stock selectionHSBC based on technical analysis of stock selection, week macd Jincha, but also heavy volume, so to buy on the approach
Exit mode: day ma20 below and bend down


HSBC - A Need for SpeedCurrently HSBC is facing a long standing resistance level at 766, this is acted as pivot back in 2008 and 2009 and as resistance in 2013.
Price action is faced with a conundrum, try and break from where it is, already relatively overextended and less oppurtunistic for new entries OR correct (retrace) over the next couple of days or weeks to get some momentum from the attach zone at 711 to 720.
Trenline confluence and near term support may give buyers the advantage and the speed it needs to move through 766 to the next level at 788'ish.
Lots over big levels to contend with on it way higher, up is good so expect some volatility if the break occurs.
