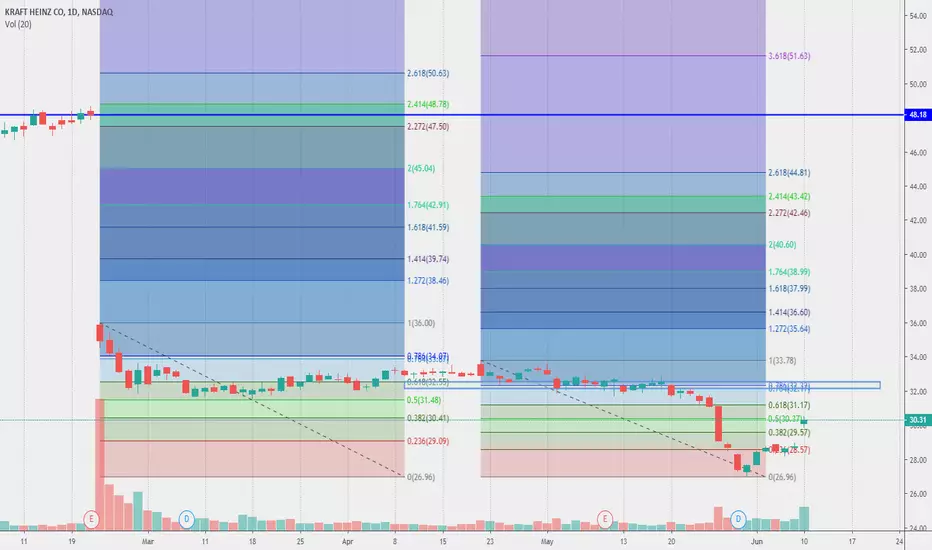
KHC - Found Support & Accumulating Hi friends, It has been a long time I haven't updated KHC idea. Since that time price action printed several signs of bottoming process is taking place. I have shown them on the chart. As mentioned in previous idea the day price opened with 30% gap down a big buyer (could be Warren Buffet ;) ) showed up and absorbed all the panic selling. It was a first and immediate sign beginning of accumulation process. Since then price hasn't moved higher but consolidated for significant time.
Subsequent drop in price after accumulation and return with gap up is our second sign of bottoming process is real and in progress. It gave up a range of accumulation $27-$31.50. I believe price will keep accumulating within that range until it breaks up.
The worst case scenario is double bottom pattern.
The best case scenario is upward gap will be tested and holds without being broken down.
Any purchase within this range will be good for investment. Obviously try to get the lowest entry possible within this range. Good strategy is as usual split your entries into at least 5 and slowly scale in.
Good Luck!
KHNZ trade ideas

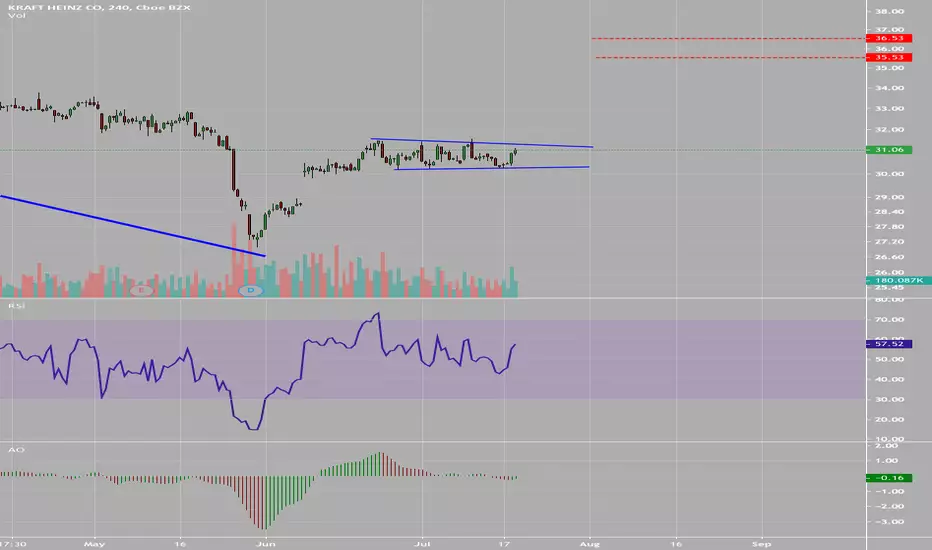
KHC - Where do we go from here?There's a monster gap to fill above blue sky here. 60% up? Or, if you believe in Fibs, 1.618 of $30, today's price range. Any buyers, besides the strange CALL interest around 31-32? Makes me wonder.
Jun 14, 2019 0.16 0.13 0.15 0.20 1290 300 KHC 31
Jun 14, 2019 0.09 -0.01 0.05 0.10 639 490 KHC 31.5
Jun 14, 2019 0.05 0.10 688 600 KHC 32
KRAFT 1D CONTINUATION TRIANGLEContinuation Triangle, Descending Triangles, Ascending Triangle and Ranges are repeatable trading chart patterns.
Triangles and ranges are consolidation chart patterns that can breakout either direction.
Ascending and descending chart patterns will have a directional bias depending on the previous incoming trend.
Each chart pattern will have defining trendlines of the support/resistance levels creating the pattern.
What ever time frame you are trading this chart pattern, wait for a candle close outside of the trendline in the direction of the breakout candle. (Our time frame preference is the Daily chart).
Add volume indicator - Volume is the amount of $ that went into a particular candle or in Forex the # of trades that took place.
Add ATR indicator - Volatility is the amount of price movement that occurred. Use the ATR to measure the price movement.
When you see descending volume bars and descending atr line (which indicates volatility) this shows
a dis-interest in traders to invest in this pair creating consolidation which creates the chart pattern.
Trade Management after there is a breakout candle close.
1 - Position size (compare volume bar to volume ma line).
a - Breakout candle must be 100% of average volume for a full position size.
b - If 75% of average volume then ½ position size.
2 - Enter two trades.
3 - SL for both trades will be 1.5 x ATR.
4 - 1st trade TP will be 1 x ATR.
5 - No TP on 2nd trade – letting profit run and adjusting SL to follow price.
6 - When 1st TP hit – move 2nd trade SL to breakeven.
7 - Adjust the 2nd trade SL to follow price.
*8 - When breakout candle is more than 1 ATR from breakout candle open.
a - Enter 1st trade at candle close with ½ position size.
b - Enter 2nd trade with a pending limit order that is 1 ATR of breakout candle open.
c – Price should pullback to that pending limit order for 2nd trade.
d – If Price returns back into chart pattern close trade before SL is hit.

KRAFT 1D RANGE TRADESRanges, Triangles, Ascending Triangle, and Descending Triangles are repeatable trading chart patterns.
Ranges & Triangles are consolidation chart patterns that can breakout either direction.
Ascending and descending chart patterns will have a directional bias depending on the previous incoming trend.
Each chart pattern will have defining trendlines of the support/resistance levels creating the pattern.
What ever time frame you are trading this chart pattern, wait for a candle close outside of the trendline in the direction of the breakout candle. (Our time frame preference is the Daily chart).
Add volume indicator - Volume is the amount of $ that went into a particular candle or in Forex the # of trades that took place.
Add ATR indicator - Volatility is the amount of price movement that occurred. Use the ATR to measure the price movement.
When you see descending volume bars and descending atr line (which indicates volatility) this shows
a dis-interest in traders to invest in this pair creating consolidation which creates the chart pattern.
Trade Management after there is a breakout candle close.
1 - Position size (compare volume bar to volume ma line).
a - Breakout candle must be 100% of average volume for a full position size.
b - If 75% of average volume then ½ position size.
2 - Enter two trades.
3 - SL for both trades will be 1.5 x ATR.
4 - 1st trade TP will be 1 x ATR.
5 - No TP on 2nd trade – letting profit run and adjusting SL to follow price.
6 - When 1st TP hit – move 2nd trade SL to breakeven.
7 - Adjust the 2nd trade SL to follow price.
*8 - When breakout candle is more than 1 ATR from breakout candle open.
a - Enter 1st trade at candle close with ½ position size.
b - Enter 2nd trade with a pending limit order that is 1 ATR of breakout candle open.
c – Price should pullback to that pending limit order for 2nd trade.


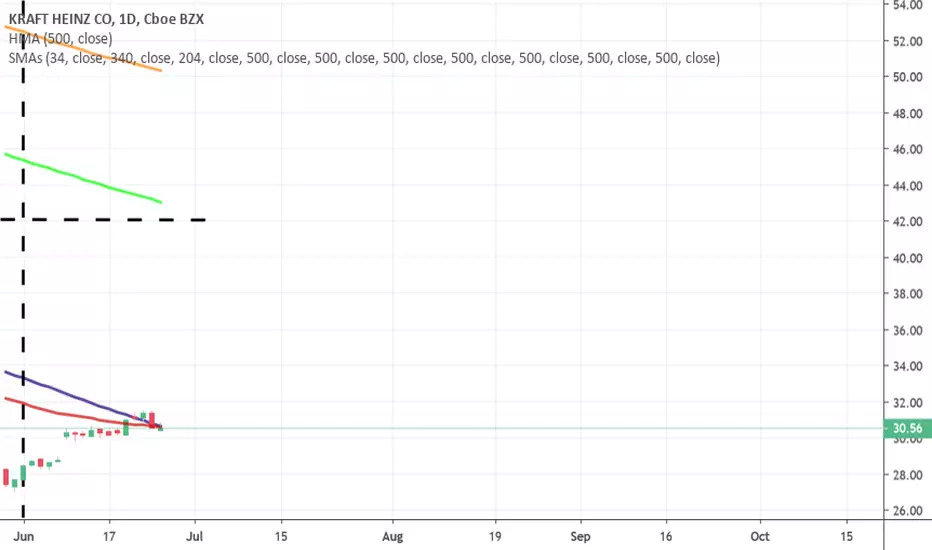
brschultz Rule#1: BUY 34 SMAx500 Hull, Profit Target 340 SMA=$48brschultz Rule#1: BUY 34 SMAx500 Hull, Profit Target 340 SMA=$48

KHC passes Daily 34 SMA x 500 Hull - Blue Skies???KHC passes Daily 34 SMA x 500 Hull - Blue Skies???

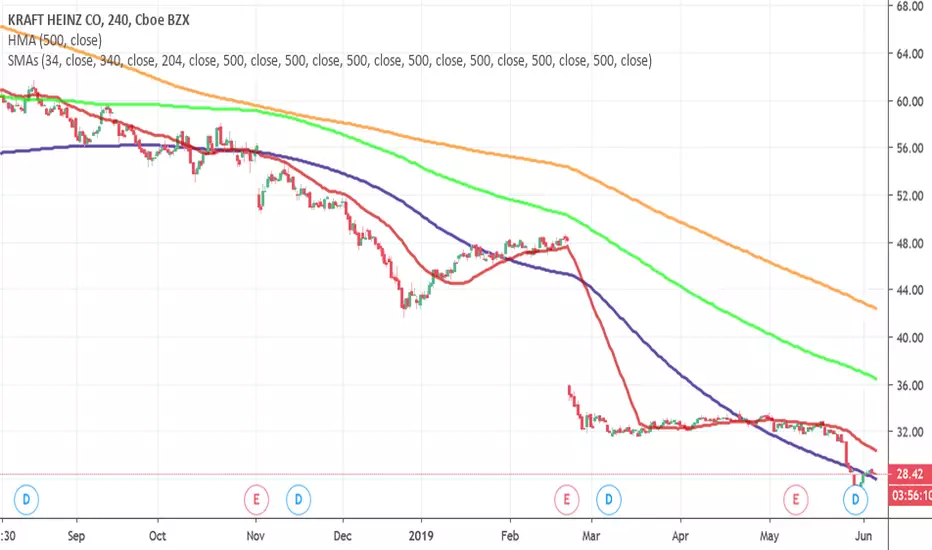
KHC Daily Testing 34 SMA v 500 Hull - What a nail biter!!!KHC Daily Testing 34 SMA v 500 Hull - What a nail biter!!!
KHC worth 34 Month SMA or $65 - I bought at $28.50 - You saw it!KHC worth 34 Month SMA or $65 - I bought at $28.50 - You saw it!

Kraft Heinz Big Test- Daily 34 SMA x 500 Hull -by Willie Makit??Kraft Heinz Big Test- Daily 34 SMA x 500 Hull -by Willie Makit??

KHC 204 Week SMA @ $70.00 - almost 2.5X dividend + 2.5x growthKHC 204 Week SMA @ $70.00 - almost 2.5X dividend + 2.5x growth

The Long Road to 340 Daily SMA 4 KHC -Nailed Bottom Perfectly??The Long Road to the 340 Daily SMA for KHC... Nailed the Bottom?

Why Blue-Chip Dividend Stocks Aren’t as Safe as You ThinkA man pulled a gun on me last week.
I was in the Ipanema neighborhood of Rio de Janeiro.
Ipanema is one of the wealthiest areas of Rio. You get iconic views of the Brazilian shore line and white sand beaches.
I was two blocks from Ipanema Beach when a man on a bike pulled in front of me.
At first, I thought he was going to sell me something. Then I saw him starting to pull a gun out of his backpack.
Fight or flight kicked in, and I started running.
In hindsight, this probably was not a good idea. But thankfully, I made it home safely.
Keeping an Eye Out for Warning Signs
I knew Rio was dangerous before visiting.
All my Brazilian friends told me not to visit because it’s so dangerous.
I figured if I stay in iconic Ipanema, I would be safe. But staying in Ipanema turned out to give me a false sense of security.
People do the same thing with investing. They convince themselves that their money is safe in a company’s stock because they took the precautions. They did their research. Everyone owns it.
But just like staying in iconic Ipanema turned out to give me a false sense of security, buying iconic “tried-and-true” stocks can yield the same result.
Take a look at Kraft Heinz.
The iconic brand lost 30% of its value in one day.
That’s despite having one of the world’s most recognizable brands, a seemingly stable business, and the backing of Warren Buffett.
Kraft Heinz had many issues. But one of the reasons the stock tanked was because management cut the company’s dividend .
And that’s a death sentence for any investment.
Bigger Can Be Better (If You Know Where to Look)
High dividend-paying stocks like Kraft Heinz (KHC) can often leave investors with regret.
And that makes sense. Many companies must pay high dividends to compensate investors for the risk of owning the company’s stock.
Some of these companies borrow money and use the debt to pay their dividend.
That’s exactly what Kraft Heinz was doing. And this strategy often ends up being a disaster for investors.
Lucky for you, I’ve spent my entire career looking for safe stocks that pay high dividends. I developed a tool that helps gauge the safety of a company’s dividend.
I call it the Dividend Sustainability Index (DSI) .
How to Select the Right Dividend-Paying Stock
You must look at three key things when evaluating dividends.
The most important is the payout ratio .
The payout ratio is the percentage of net income a firm pays to its shareholders as dividends.
The lower the payout ratio, the safer the dividend payment.
The second is the debt-to-equity ratio .
The more debt a company has, the harder it gets to run a business. This includes—you guessed it—paying the dividend.
The third is free cash flow. This is the amount of cash left over after a company pays its expenses.
If any of these measures is flashing red, you know the dividend is in trouble.
A low DSI score tells me that the odds are high that a company will be forced to cut its dividend.
And that’s bad news for shareholders.
A Dividend Cut Can Wipe Out Your Profits
Kraft Heinz wasn’t the only iconic brand to tank on a dividend cut as of late.
General Electric (GE) surprised investors and slashed its dividend 50% in November 2017.
GE shares were punished on the news, getting chopped over 10%.
One year and a second dividend cut later, shares have been smashed 57% .
The Dividend Sustainability Index (DSI) will keep you out of stocks like Kraft Heinz and GE. By using methods like the DSI, you can have real security with your income investments.


Small but possibly very impiortant bullish pattern on KHCKHC is forming a bullish Island Reversal. Recently the stock gapped down below 29.00 and never filled. Today it gapped above 29.00. Could this be the bottom. It is a retest gap so I will give it a few days to a week to retest to take a small position.

Astounding Results - KHC up 4% this morning after bottom callAstounding Results - KHC up 4% this morning after bottom call

Early Entry For UpswingEnroute to breaking previous peak with oscillator/indicator action showing upswing direction

KHC 4 Hr Interesting 340 SMA cross huge resistance @ my buy ptKHC 4 Hr Interesting 340 SMA cross huge resistance @ my buy pt

KHC - IF 3 HOUR 34 SMA CAN BOUNCE OFF 500 HULL - IT'S GO TIME!!!KHC - IF 3 HOUR 34 SMA CAN BOUNCE OFF 500 HULL - IT'S GO TIME!!!

KHC Worth at least 34 week SMA or $40.00/share hereKHC Worth at least 34 week SMA or $40.00/share here

