PLUG POWER - DAILY KEYLEVELSPLUG POWER - DAILY KEYLEVELS
These are my new keylevels to watch on daily tf.
i dont like this rising wedge , also beceause he is in a downtrend.
PLUN trade ideas

PLUG POWER - READY FOR THE PUMP?PLUG POWER - READY FOR THE PUMP?
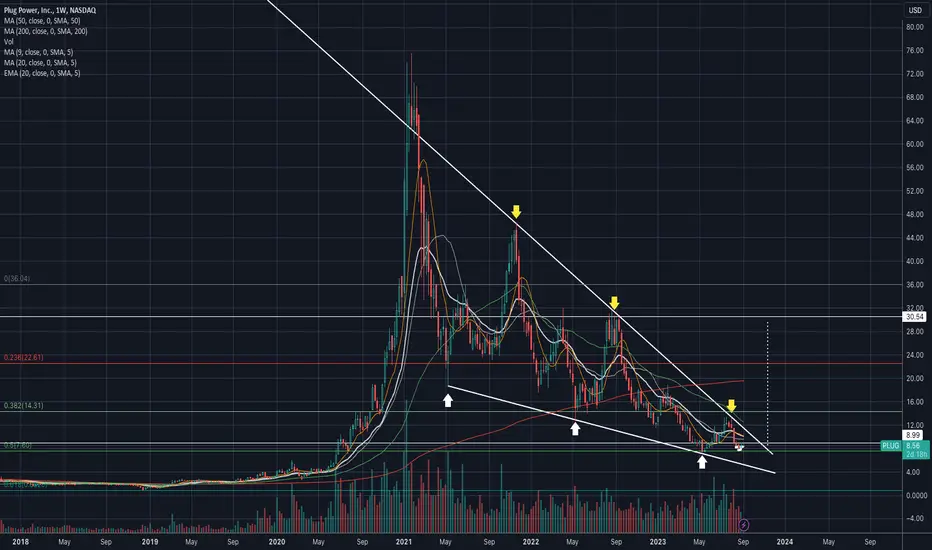
As you can see, on weekly Time Frame we have a beautiful falling wedge, if this pattern will be broken with a broken resistance confirmation, there is a potential 10x in play.
I have an average between 3-4 USD so in my case 30-32 area will be an 8x

Plug Power - price correction or trend change? So, quickly. The price is still in a downtrend, and confirmations of a change are relatively high (changes on a high interval). On the positive side, we have reached the liquidity level from which the last significant increases occurred in 2020/21. This means the price could be very attractive for investors again. Those who invested here a long time ago in the long term may want to do it again or defend their remaining orders.
Let's take a look at a lower interval. On the 24-hour chart, it can be seen that an uptrend is starting to build, which may want to grow to around $6.5 per share, where the last liquidity for declines was.
What would I do? I would buy a package of shares and count on increases to around $6-6.50, then observe. If the price in the short zone wants to continue to decline, I would sell the package and wait for a more attractive price. If, however, the price passes through the $6-7 zone and goes up, on the retest, I would make additional purchases and count on a double-digit amount, as the next major stop could be around $10.
If the price NOW falls below $3 and closes there, it will mean that the only double-digit amount we will see in the near future will be after the decimal point.

PLUG POWER long Ich hatte es gestern bereits gepostet. Wir werden steigen. 6-7$ Lursziel in den nächsten Tagen. Folge mir auch gerne über www.buymeacoffee.com

Bullish PLUG targetPLUG has been consolidating in a descending wedge. If price breaks to the upside, target is marked.
Not financial advice.

PLUG POWER - 2W - UPDATEThese are my keylevels for Plug Power.
As you can see, the price is stopped at the support zone and also it is in a 0.5fib area from entire structure so, it is an important level.
I will add more shares tomorow in my portofolio to increase my average buy


PLUG Short IdeaFirst stock idea I've shared... *gasp*
For the past 8 years, my strategy has mostly just been to hold a bunch of tech and green energy stocks forever, and that worked quite well, until recently.
Now that I'm a little more tuned in to Macro, markets, etc, I see nothing bullish right now, and would rather be in cash to set buys at lower levels. I also want to concentrate my portfolio (diversifying is how you save money, not make money - also, I care more about crypto anyway)
Nothing against PLUG - it's been one of my biggest gainers over the years... I just wish I took profit sooner...
Honestly it's just the technicals that makes me wanna short this. It's failing to break resistance as the rest of the market is puking.
On the one hand, it's bullish that PLUG hasn't dumped with tech stocks. On the other... maybe it's just late.
I definitely intend to buy all my PLUG back as I think it's a great company doing good work to transition us to green transportation :3

PLUG POWER - GREAT OPPORTUNITYThese are my Keylevels for PLUG.
Just look how beauty it is.
I love price action and that one gives me the possibilty to make and have an amazing chart = opportunity.
I starting to acumulate PLUG.
As you can see, there is an upptrend on 2W and a falling wedge on DAILY.

PLUG Plug Power Options Ahead of EarningsAnalyzing the options chain and the chart patterns of PLUG Plug Power prior to the earnings report this week,
I would consider purchasing the 6usd strike price in the money Calls with
an expiration date of 2023-11-10,
for a premium of approximately $0.54.
If these options prove to be profitable prior to the earnings release, I would sell at least half of them.
Looking forward to read your opinion about it.


Does history repeat itself?The previous correction cycle, after breaking the local low, ended with a cup and a nice bounce came.
The current situation is reminiscent of the previous one.
However, if there is a similar volume of short closing now, the down trend of about two years can easily be broken.
I also see signs of this on a larger time plane, on a weekly chart.

Strong bullish MACD divergence
Strong bullish MACD divergence on a weekly chart.
I think we are close to the breakout.

Plug Power -> Another 10.000% PumpMy name is Philip, I am a German swing-trader with 4+ years of trading experience and I only focus on price action and market structure 🖥️
I am trading the higher timeframes because this allows me to massively capitaliz e on the major market swings and cycles without getting caught up in the short term noise.
This is how you build real long term wealth!
In today's anaylsis I want to take a look at the bigger picture on Tesla.
Looking at Plug Power stock you can see that after the recent -90% correction Plug Power is now retesting a cluster of support zones from which we could see a decent move higher. Keep in mind that this is a very risky stock so keep your risk small on this trade.
- - - - - - - - - - - - - - - - - - - -
When the market moves where, and how, and if - these are all unknown.
The only thing which you can control is your risk.
- Philip Basic Trading -
Keep the long term vision🫡

trade recomendation on PLUGhi everybody
as you see, the chart of PLUG compact in the bearish triangle.
if the price break the high band of this triangle, you must be patient for pullback to a support, for take long position.
------------------------
in the market, you have to your decision and got responsibility of your behavior.

PLUG CallBuy Oct-06-23 8 Calls @ 0.18 Limit to Open
CCI oversold, Squeezed by Bollinger Bands and at small but critical support with the SR Channel.
Bought for 1.5 week expiration.

Inver Head and Shoulders for PlugNASDAQ:PLUG is one of the stocks that have been sold heavily in August and September. The price action shows consolidation. There is a potential inverse H&S in play. The initial target is 10. If we can break the down trend, this can fly towards 18.
Disclaimer – WhaleGambit. Please be reminded – you alone are responsible for your trading – both gains and losses. There is a very high degree of risk involved in trading. The technical analysis , like all indicators, strategies, columns, articles and other features accessible on/though this site is for informational purposes only and should not be construed as investment advice by you. Your use of the technical analysis , as would also your use of all mentioned indicators, strategies, columns, articles and all other features, is entirely at your own risk and it is your sole responsibility to evaluate the accuracy, completeness and usefulness (including suitability) of the information. You should assess the risk of any trade with your financial adviser and make your own independent decision(s) regarding any tradable products which may be the subject matter of the technical analysis or any of the said indicators, strategies, columns, articles and all other features.

Hydrogen caseHi. I show PLUG chart overlayed with the three major hydrogen ETF charts. It shows that plug is landing on two prior peaks just as the ETF’s “bottom”. The ETF charts look like they will break out of the bearish channel soon. So, a bullish reversal in plug lines up nicely with bullish reversals in the ETFs, which makes sense. I also show an arrow pointing out where FCEL is in it’s chart. It’s a much older and slower chart than PLUG, but the amplitude is bigger. I bought FCEL at $2.40, and riding it down to, probably, $.81, which closes a gap on the vpvr. It is what it is. By the time I’m in long-term gains, FCEL will be reaching for $100

PULL THE PLUG... GET IT get it get it (annoying kid upclose voice)
im pullin the plug with price rejecting my supply
correlating with some bad economic fundamentals
i like this company social investing fasho
but this guy is unfortunately gonna get thrashed (maybe insiders wanna get their shares back idk)
id love to talk more but meh this tech definietly the future
regardless its gonna crash
and thousand percent spike in like 2026-28 or something if you want more insight i update on posts with 5 or so likes

$PLUG - Could see a reversalNASDAQ:PLUG is trading inside a multi-year descending wedge. There is a potential inverse head and shoulder forming on the hourly chart.
Breaking above $9 could send the stock to $10.50 in the near term.
The stock has 19.90% short interest, making it a potential short squeeze candidate.
In the long term, if the stock can break out of that wedge, it could potentially reach $30.
Targets:
- $10.50
- $12
- $14
- $19
Risk:
- $7.60 - $5
Follow me for Charts and trade ideas.
PLUG | Buy zones | Hydrogen risingGeneral
Looking at 2 zones where i will buy equally amounts of PLUG for longterm hold.
First buy zone is based on the support zone that generated the recent swing high (red circle).
Main buy zone is a resistance level that gave support after it was broken for the big upswing.
Target: Correlation between 50% of the weekly range and top of the last swing.
Stop-Loss: None (Long term investment)
Good luck
Disclaimer:
- This information does not constitute as financial advice and is only for educational purposes. I am not your financial advisor.
- You trade entirely at your own risk
- Make your own research
- Finance and trading is evil, capitalism is bad, duh ;)

PLUG Bull FlagThis could be the time PLUG turns around
PLUG is nearing some long-term support -- assuming the trendline holds, it's a good entry point. Worst case, be sure to use stop losses!

HYDROGEN IS A FUTURE OF ENERGYEnergy transition policies are likely to be major fundamentals behind this investment opportunity. A 20 year frustrating bottoming process, reflecting un certainity, seems approaching a viability, nowadays. It could easily push the stock swiftly higher, testing some major longtime resistance/support while forming a typical trend reversal CUP&HANDLE pattern.
