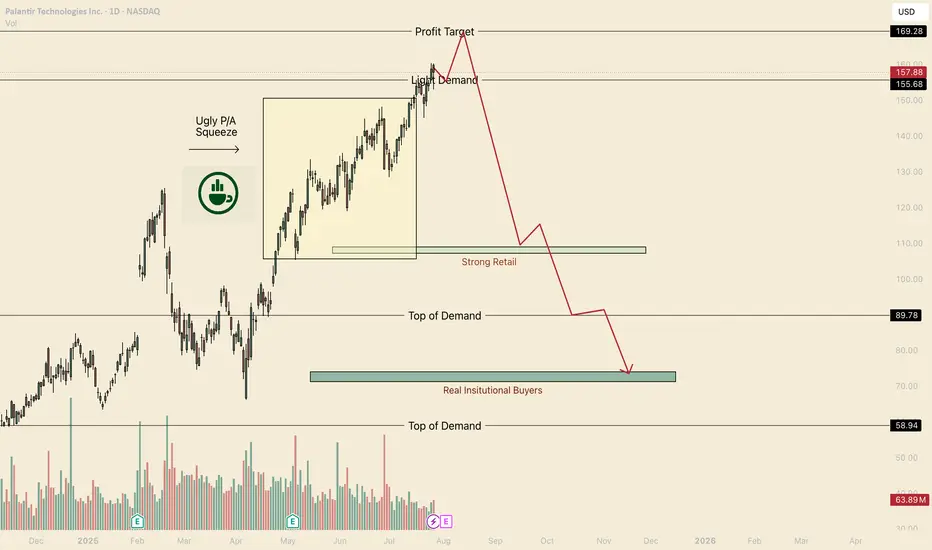
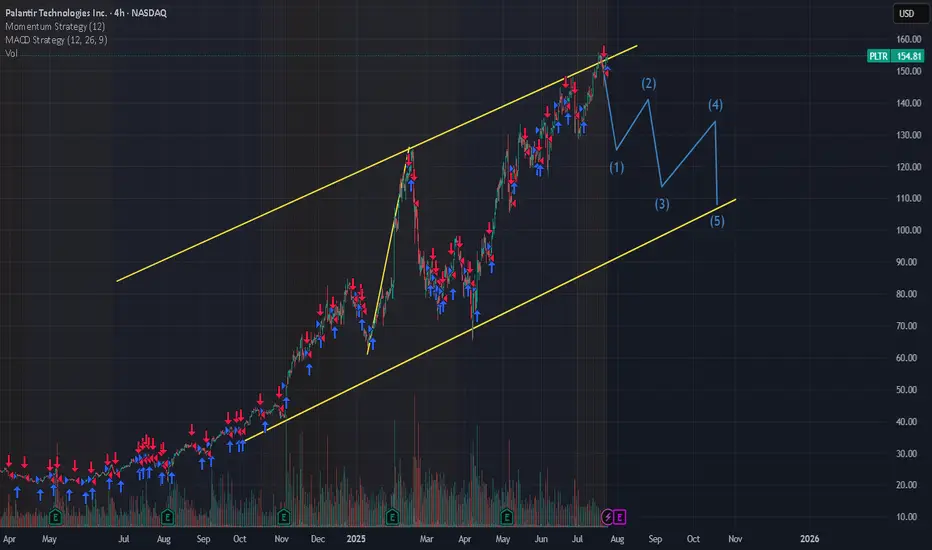
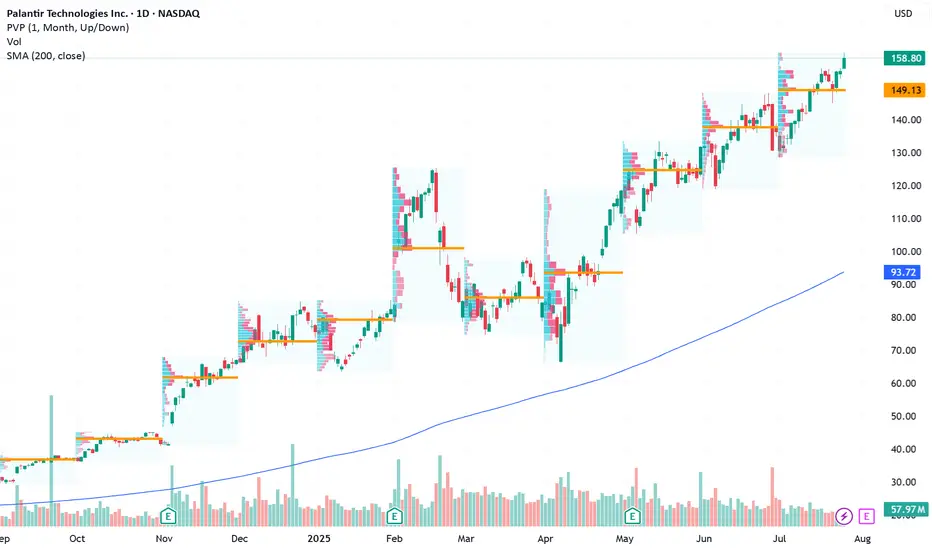
Hot Take, PLTR is a BubbleHello I am the Cafe Trader.
Price Action suggest we haven't had a proper buyer since $90.
Now I know that this can sound a bit off putting (especially if you bought above $90).
Even if this crashed, I am not suggesting you sell your long term position. I would instead look into hedging your posi
Next report date
—
Report period
—
EPS estimate
—
Revenue estimate
—
0.24 EUR
446.47 M EUR
2.77 B EUR
2.16 B
About Palantir Technologies Inc.
Sector
Industry
CEO
Alexander Caedmon Karp
Website
Headquarters
Denver
Founded
2003
FIGI
BBG00XJDTKC9
Palantir Technologies, Inc. engages in the business of building and deploying software platforms that serve as the central operating systems for its customers. It operates through the Commercial and Government segments. The Commercial segment focuses on customers working in non-government industries. The Government segment is involved in providing services to customers that are the United States government and non-United States government agencies. Its platforms are widely used in areas such as defense, intelligence, healthcare, energy, and financial services, supporting data integration, large-scale analytics, and operational decision-making. The company was founded by Alexander Ceadmon Karp, Peter Andreas Thiel, Stephen Cohen, Joseph Lonsdale, and Nathan Dale Gettings in 2003 and is headquartered in Denver, CO.
Related stocks
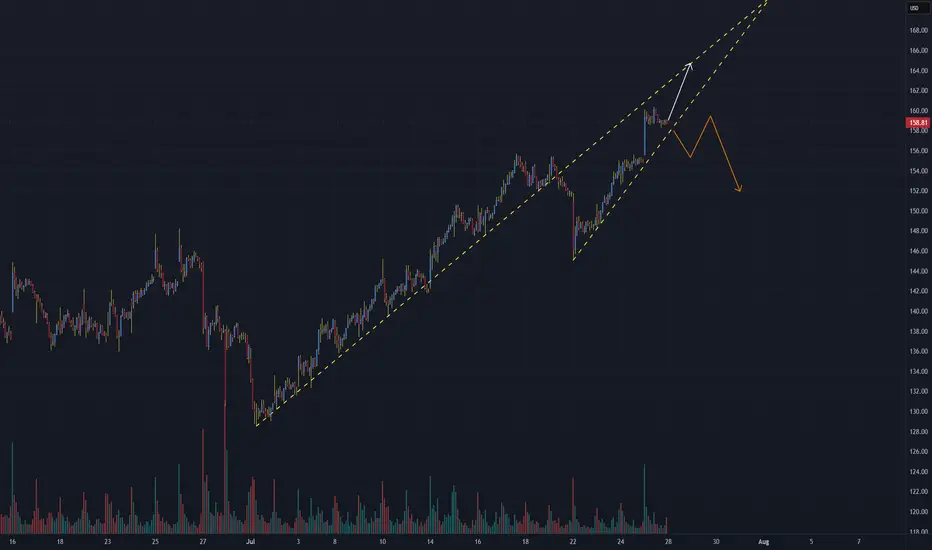
PLTR - Rising wedge formation leads to potentially larger move🧠 PLTR WEEKLY TECH+FUNDAMENTAL BRIEF
Ticker: NASDAQ:PLTR | Sector: AI / Big Data / Defense Tech
Date: July 27, 2025
🔍 Chart Watch: Rising Wedge Risk
Palantir is trading within a rising wedge formation, a pattern often signaling bearish reversal if upward momentum fades. Recent price action has ti
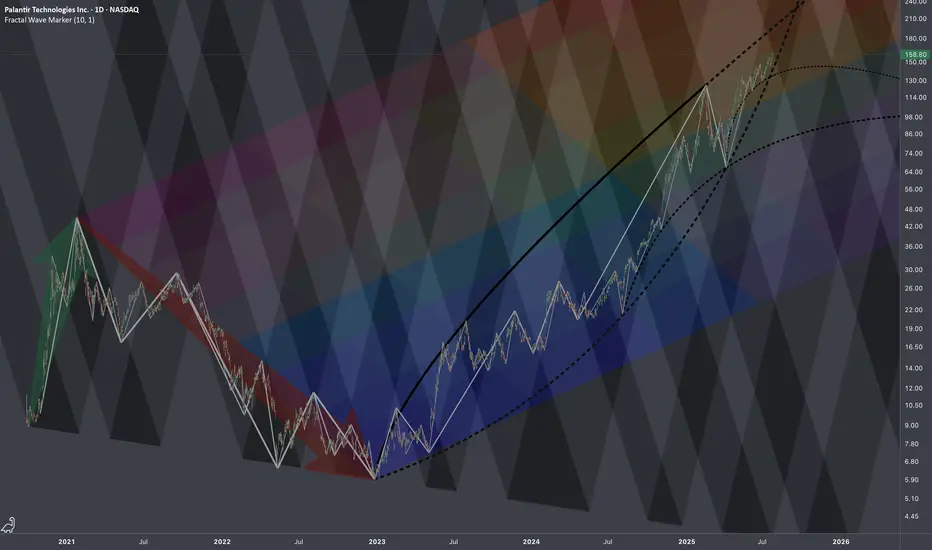
$PLTR: Regressive Heatmap🏛️ Research Notes
Technically this looks overbought, but fundamentally we know that under current administration this company is clear beneficiary (new contracts). Seems to explain why chart's dips were bought off extending bullish phases of cycle. However, there is still always a limit (as price
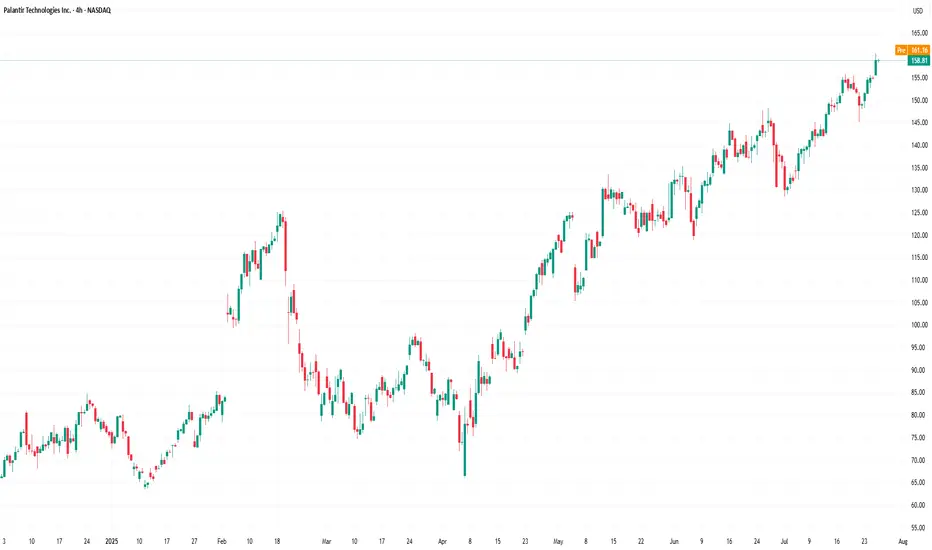
Palantir Technologies (PLTR) Shares Surpass $160Palantir Technologies (PLTR) Shares Surpass $160 for the First Time
Shares of Palantir Technologies (PLTR), a company specialising in big data analytics software, have continued their impressive performance. Following an extraordinary rally of approximately 340% in 2024, the stock remains among th
Guys take profit for PLN. A big correction coming soon.Guys take profit for PLN. A big correction coming soon. Based on technical, all the stock market over bull and a big correction coming with in a month. Pls be careful.
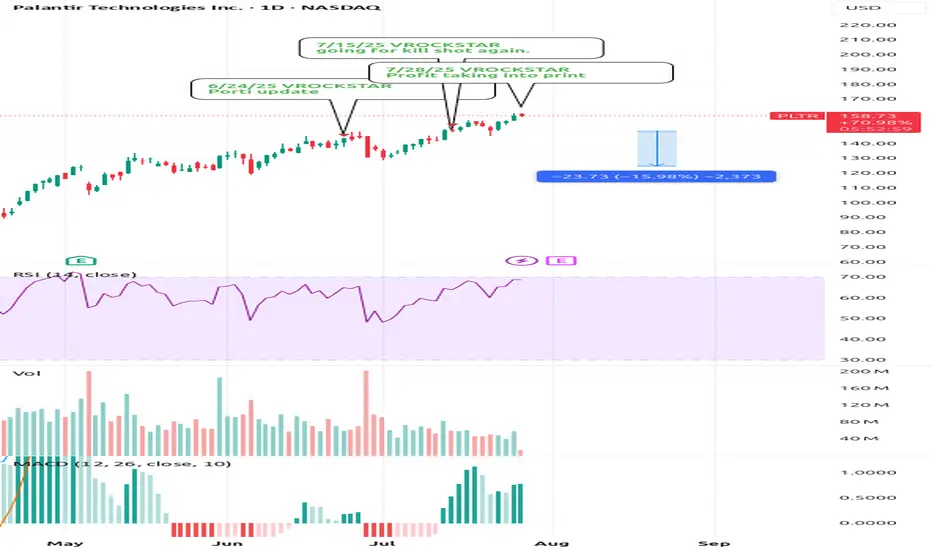
7/28/25 - $pltr - Profit taking into print7/28/25 :: VROCKSTAR :: NASDAQ:PLTR
Profit taking into print
- no idea what print brings
- but mgmt have been sell-only
- valuation is what it is... inexplicable by anyone
- i'd not be surprised to see anything happen on the result
- but into result, big holders (read: not you) are likely going t
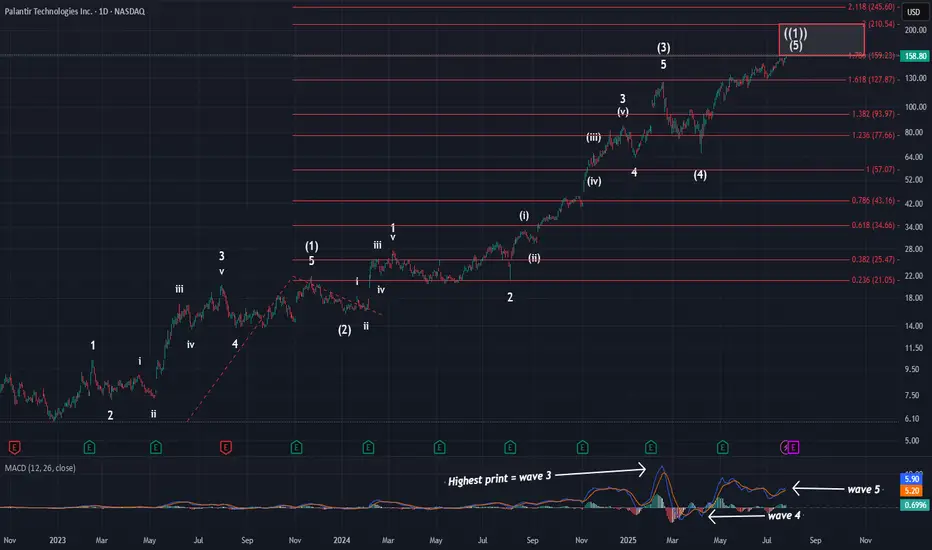
PalantirOn Friday, price hit the 1.236 extension and the larger red 1.786 extension @ $159. Tonight, I wanted to zoom out to show you where price is in the grand scheme of things. As you can see, we have all of the needed waves in place to consider this larger pattern complete. We have finally hit the stand
PLTR WEEKLY TRADE IDEA – AUG 2, 2025
📈 **\ NASDAQ:PLTR WEEKLY TRADE IDEA – AUG 2, 2025** 📈
⚡️ *Earnings Week Setup – Mixed Signals, But Bullish Flow*
---
🧠 **SENTIMENT SNAPSHOT**
• Call/Put Ratio: **2.29** = Bullish
• Volume Ratio: **1.1x** = Weak breakout support
• VIX: **20.38** = Normal vol, clean setups possible
📉 **RSI DIVERG
PLTR Long trade!🟢
You’re expecting price to move upward, and your chart reflects a breakout setup with multiple resistance levels marked.
🔍 Key Technical Elements Noted:
Ascending triangle breakout:
The pink trendlines show an ascending triangle (bullish pattern) that successfully broke out.
Support Zone:
Aroun

Long Setup for Continued Growth Potential Next WeekCurrent Price: $158.80
Direction: LONG
Targets:
- T1 = $162
- T2 = $166
Stop Levels:
- S1 = $157
- S2 = $153
**Wisdom of Professional Traders:**
This analysis synthesizes insights from thousands of professional traders and market experts, leveraging collective intelligence to identify high
See all ideas
Summarizing what the indicators are suggesting.
Neutral
SellBuy
Strong sellStrong buy
Strong sellSellNeutralBuyStrong buy
Neutral
SellBuy
Strong sellStrong buy
Strong sellSellNeutralBuyStrong buy
Neutral
SellBuy
Strong sellStrong buy
Strong sellSellNeutralBuyStrong buy
An aggregate view of professional's ratings.
Neutral
SellBuy
Strong sellStrong buy
Strong sellSellNeutralBuyStrong buy
Neutral
SellBuy
Strong sellStrong buy
Strong sellSellNeutralBuyStrong buy
Neutral
SellBuy
Strong sellStrong buy
Strong sellSellNeutralBuyStrong buy
Displays a symbol's price movements over previous years to identify recurring trends.
Frequently Asked Questions
The current price of PTX is 136.36 EUR — it has increased by 1.90% in the past 24 hours. Watch PALANTIR TECH INC stock price performance more closely on the chart.
Depending on the exchange, the stock ticker may vary. For instance, on XETR exchange PALANTIR TECH INC stocks are traded under the ticker PTX.
PTX stock has fallen by −0.63% compared to the previous week, the month change is a 19.68% rise, over the last year PALANTIR TECH INC has showed a 487.00% increase.
We've gathered analysts' opinions on PALANTIR TECH INC future price: according to them, PTX price has a max estimate of 156.06 EUR and a min estimate of 35.07 EUR. Watch PTX chart and read a more detailed PALANTIR TECH INC stock forecast: see what analysts think of PALANTIR TECH INC and suggest that you do with its stocks.
PTX stock is 2.13% volatile and has beta coefficient of 2.25. Track PALANTIR TECH INC stock price on the chart and check out the list of the most volatile stocks — is PALANTIR TECH INC there?
Today PALANTIR TECH INC has the market capitalization of 314.31 B, it has increased by 6.52% over the last week.
Yes, you can track PALANTIR TECH INC financials in yearly and quarterly reports right on TradingView.
PALANTIR TECH INC is going to release the next earnings report on Aug 4, 2025. Keep track of upcoming events with our Earnings Calendar.
PTX earnings for the last quarter are 0.12 EUR per share, whereas the estimation was 0.12 EUR resulting in a 1.05% surprise. The estimated earnings for the next quarter are 0.12 EUR per share. See more details about PALANTIR TECH INC earnings.
PALANTIR TECH INC revenue for the last quarter amounts to 816.98 M EUR, despite the estimated figure of 796.94 M EUR. In the next quarter, revenue is expected to reach 797.40 M EUR.
PTX net income for the last quarter is 197.84 M EUR, while the quarter before that showed 76.32 M EUR of net income which accounts for 159.22% change. Track more PALANTIR TECH INC financial stats to get the full picture.
No, PTX doesn't pay any dividends to its shareholders. But don't worry, we've prepared a list of high-dividend stocks for you.
As of Aug 4, 2025, the company has 3.94 K employees. See our rating of the largest employees — is PALANTIR TECH INC on this list?
EBITDA measures a company's operating performance, its growth signifies an improvement in the efficiency of a company. PALANTIR TECH INC EBITDA is 402.40 M EUR, and current EBITDA margin is 11.93%. See more stats in PALANTIR TECH INC financial statements.
Like other stocks, PTX shares are traded on stock exchanges, e.g. Nasdaq, Nyse, Euronext, and the easiest way to buy them is through an online stock broker. To do this, you need to open an account and follow a broker's procedures, then start trading. You can trade PALANTIR TECH INC stock right from TradingView charts — choose your broker and connect to your account.
Investing in stocks requires a comprehensive research: you should carefully study all the available data, e.g. company's financials, related news, and its technical analysis. So PALANTIR TECH INC technincal analysis shows the buy rating today, and its 1 week rating is buy. Since market conditions are prone to changes, it's worth looking a bit further into the future — according to the 1 month rating PALANTIR TECH INC stock shows the buy signal. See more of PALANTIR TECH INC technicals for a more comprehensive analysis.
If you're still not sure, try looking for inspiration in our curated watchlists.
If you're still not sure, try looking for inspiration in our curated watchlists.