Bull and Bear case of TSLA1. Bull Case
Support & Potential Reversal Zones
$275–$280 appears to be the next support band on the Volume Profile.
$255–$238 also shows elevated volume, potentially acting as a secondary support if $275 fails.
Oversold Momentum Indicators
RSI is around 39, nearing oversold territory (<40). A reversal above 50 would signal renewed bullish momentum.
Stochastics around 20 is also in oversold range, hinting a short‐term bounce could be on deck.
Moving Averages (MAs)
The stock is trading below short‐term MAs (likely 9, 21, 50‐day).
Bullish trigger: A daily close above the 50‐day MA (currently near $340–$350) with rising volume would strongly suggest a bottom is in.
Upside Targets
$341–$353: Initial resistance from prior swing lows and converging MAs.
$415: Next major supply zone if TSLA can reclaim and hold above $353.
$488–$550: Longer‐term targets if a strong bullish trend re‐emerges.
Bullish Confirmation:
A bounce off $275–$280 or $255–$2188.
Momentum turning positive: RSI > 50 and Stochastics crossing up from oversold.
2. Bear Case
Downtrend & Lower Highs
TSLA has made lower highs since its peak (~$550), indicating a persistent downtrend.
The descending trendline from $490–$415–$353 remains intact.
Momentum Oscillators
RSI < 50 and drifting near 39: still in the bearish zone.
PMO (~-2.8 / -5.3) suggests ongoing negative momentum.
Further Downside Levels
If $275 breaks, next high‐volume nodes are around $255–$238.
A drop below $238 could open the door to $219, then the bigger gap area near $170 or even $138 if the sell‐off accelerates.
Moving Averages
Price is below key MAs, which have likely started rolling over (bearish slope).
Until price reclaims them, rallies may be short‐lived.
Bearish Confirmation:
A daily close below $275 .
RSI remains under 40, and PMO continues trending downward.
3. Which Side Is TSLA Currently Inclined Toward?
Short‐Term Bias: Bearish
Price remains below short‐term MAs, RSI < 50, and a negative PMO all point to continued downside or at best a weak bounce.
Possible Bounce:
Stochastics/RSI oversold suggests a short‐term relief rally is possible, but any upside must reclaim $340–$350 to meaningfully change the trend.
Overall, bears have the upper hand unless TSLA defends a strong support (like $275–$280) and reverses, pushing RSI back above 50. If support fails, expect further downside toward $255–$238 and potentially lower $218.
TL0 trade ideas

TESLA Swing Long! Buy!
Hello,Traders!
TESLA is going down
But will soon hit a
Horizontal support level
Of 254.86$ from where
We will be expecting a
Further bullish rebound
Buy!
Comment and subscribe to help us grow!
Check out other forecasts below too!

Bulls struggling to hold major trend support, is it over?boost and follow for more ❤️🔥unfortunately tesla is breaking some major pivot level and trend support.. but there is the last line of support around 280 @ the 200 SMA
if we can hold that then this could all be a big short trap before the next big Tesla rally.. 🚀
lets see what happens, good luck to everyone.. see you soon with more 💪

TSLA: pullback for a next round!TSLA: pullback for a next round!
-ABCD pattern.
-Key level and demand zone support.
-Logical volume and spread!
.
US STOCKS- WALL STREET DREAM- LET'S THE MARKET SPEAK!

Nicest setup I’ve seen in a while-Not complicated; why make it?Tesla with perfect technically sound pattern
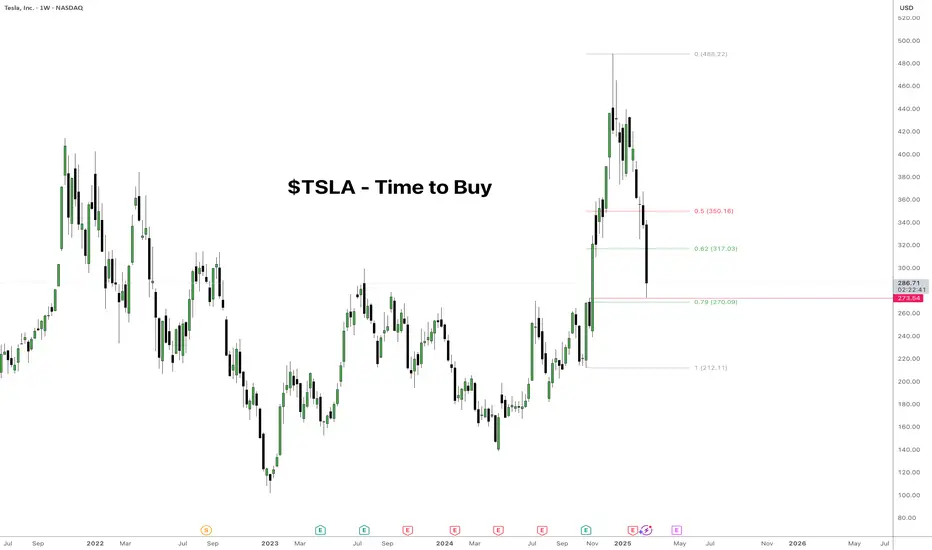
Five or six things coming together, including a perfect tag of the breakout line, a perfect tag of the long-term uptrend line a Bollinger band crash perfect tag of the Fibonacci .62
It’s like a perfect set up
Not very complicated; why make it complicated?

TSLAIt just finished the Price Corrextion and it takes some time to $414
becauese of " Time Correction period" .
But It will start the 5th Elliot Wave.

TSLA - $350 Magnet Update to my previous post, looking for for a nice technical bounce in March... would not want to be short here
Chart speaks for itself, with key pivot points shown. I'm out at $350 and will consider going short again there... otherwise take profits at $330 if bulls run out of steam

$TSLA - Time to BuyHello Friends,
We now have agreat opportunity to buy NASDAQ:TSLA after the price correction
Correction before global spaceAccording to logarithms, we follow the global cycle of 5 waves. But now there is a correction of wave 4, the target for it is in the area of the last lows in the region of $ 105. Next, you can prepare for the 5th wave, where the goals are above > $ 2000 on the horizon of 2-4 years.

Long Tesla (day traders only, investors stay away)
The chart speaks on its own behalf, when it gets to the top yellow line, you sell it. Follow me for more recipes

Telsa - Buy Cycle Tesla
Spot
Buy cycle
Tp@485.5
% bubble
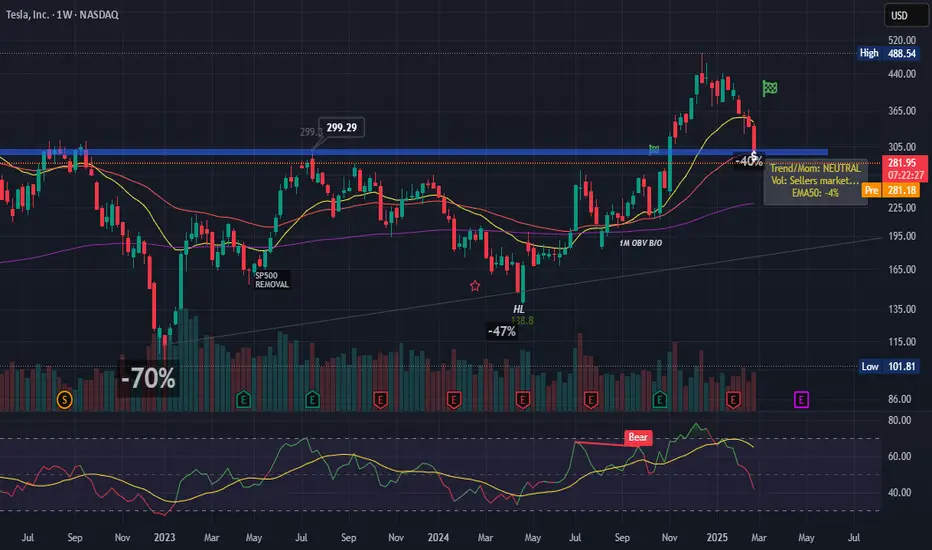
Tesla Fair value in mid term is 485.5
it is in a negative bubble (-40% at the time i am writing)
Trading plan:
Entry 1: 388
Entry 2: 339
Entry 3: 291
Entry 4: 242
TP: 485.5

TSLA - support & resistant areas for today Feb 27, 2025Here are the key support and resistance levels for TSLA today, which may indicate where the price could reverse or consolidate. These levels might signal potential long (buy) or short (sell) positions for traders.
Calculated using mathematical models, these levels are relevant for today’s trading session and may change in the future.
If you find this helpful and want to receive these insights every morning at 9:30 AM, please support me by boosting this post and following me. Your engagement is appreciated! If this post doesn't receive more than 10 boosts, I may reconsider these daily updates. Thank you!

TSLA - TP#1 308-312TSLA dipped -40% into the support zone of the presidential election. This is monthly. I expect to rise towards #325 and a chance to TP in between without waiting.
I bought at $289.
TSLA IS A BUY at $280, add $270, bounces to $353TLA is becoming oversold here and we are at longer term support which is either $280 or $270 depending, I would start a position and be prepared to ADD on any further weakness. Fitsr target $353

TSLA Approaching a Critical Reversal Zone! Can $280 Hold? Feb.28Technical Analysis (TA) & Price Action
Tesla (TSLA) remains in a strong downtrend, trading within a well-defined falling wedge pattern. The stock is currently testing a major support zone around $280, which aligns with the highest negative NETGEX and significant PUT walls. A breakdown from this level could open the door for a steeper decline toward $250, while a bounce could lead to a sharp reversal rally.
Key observations:
* Trend Structure: TSLA is in a clear downtrend, but nearing exhaustion based on technical indicators.
* Support & Resistance:
* Major Resistance: $297-$300 (breakout confirmation level).
* Key Support: $280 → If this breaks, expect further downside toward $250.
* Breakout Target: $310 - $350 if momentum shifts.
* MACD Indicator: Showing a slight bullish divergence, which could signal an upcoming reversal.
* Stoch RSI: Oversold at 37.67, indicating potential upside pressure if buyers step in.
Options Flow & GEX Analysis
The GEX (Gamma Exposure) indicator suggests that TSLA is heavily weighted on the PUT side, with the highest negative gamma near $280. This implies that if $280 breaks, the next big support is around $250. However, if $280 holds, a short squeeze could push TSLA toward $300+ quickly.
* IVR (Implied Volatility Rank): 74, with IVx avg at 77.9%, showing high volatility expectations.
* Call Side Bias: 31.9% of options flow, indicating some bullish positioning.
* Key GEX Levels:
* PUT Wall & Key Support: $280 → A breakdown could bring $250 as the next stop.
* CALL Resistance & Upside Target: $300 → A move above this level could send TSLA toward $350+.
Trade Plan & Suggestions
📌 Bullish Reversal Setup (Preferred Play)
* Entry: Above $285 with strong volume confirmation.
* Target 1: $300
* Target 2: $310-$350 (Extended breakout target).
* Stop-loss: Below $278
📌 Bearish Breakdown Setup (Hedge Play)
* Entry: Below $278 with strong selling pressure.
* Target: $265 → $250
* Stop-loss: Above $285
Final Thoughts
TSLA is at a crucial inflection point, with $280 acting as the major battleground. If buyers defend this level, expect a short squeeze rally toward $300+. But if this level fails, the next leg down could accelerate toward $250. Volume confirmation is key before making a trade.
📢 Risk Management: Keep tight stop-losses, wait for confirmation, and be ready for volatility.
🔹 Disclaimer: This analysis is for educational purposes only and does not constitute financial advice. Always conduct your own research and manage risk accordingly before trading.

TSLA Update to price entry - $255 TSLA is giving us great info. Today's and yesterday's declines were indicative of a stock that is not yet ready to stop falling. We are not there yet, but we are getting pretty close. We may have made a small bottom that moves us to $312, and then under many scenarios makes a new low at $255 or so. That buy zone stops out near $222. Elliotwave, Murrey Math, Kumarwave.
