XONA trade ideas
Exxon 8 RRR shortTrading Methodology:
1. An asymmetric bullish/bearish pennant is drawn using ascending and descending curved trend lines with a minimum of three price action touche points per line. The direction is determined by the previous trend.
2. The angle tool is applied from the earliest two trend touch points, beginning at the earliest touch point.
3. A trend-based Fibonacci retracement triangle is drawn starting from the earliest trend touch point and ending at the earliest touch point of the opposite trend line .
4. Based on the degree, of the earlier defined angle, the appropriate (and secret) levels are selected for the fibonacci retracement ; two levels for stop-loss and two levels for take-profit. The closest stop-loss level to the current price level is the top priority stop-loss. Though the secondary stop-loss level is often chosen for some markets such as FX and some equities in order to account for seldom unexpected resistance breaks. The greater target level is the top priority, and where majority of the shares are sold, though some may choose to close part of the position at the first target level or set it to be the stop-loss once price exceeds it. Entries should be laddered in around the levels closest of the yellow line.
This trading strategy can be applied to any market and time frame, and positions most often garner the greatest risk-to-reward ratio with the highest success rate. What more can you ask for? I will only be posting my unique trading strategy until EOY. I work solely with price action to identify pennants and apply unique trend-based fibonacci retracement levels for SL and TP levels. Reach out to me if you have any questions.
Exxon worth $119 by 2025 (8 RRR long)Trading Methodology:
1. An asymmetric bullish/bearish pennant is drawn using ascending and descending curved trend lines with a minimum of three price action touche points per line. The direction is determined by the previous trend.
2. The angle tool is applied from the earliest two trend touch points, beginning at the earliest touch point.
3. A trend-based Fibonacci retracement triangle is drawn starting from the earliest trend touch point and ending at the earliest touch point of the opposite trend line .
4. Based on the degree, of the earlier defined angle, the appropriate (and secret) levels are selected for the fibonacci retracement ; two levels for stop-loss and two levels for take-profit. The closest stop-loss level to the current price level is the top priority stop-loss. Though the secondary stop-loss level is often chosen for some markets such as FX and some equities in order to account for seldom unexpected resistance breaks. The greater target level is the top priority, and where majority of the shares are sold, though some may choose to close part of the position at the first target level or set it to be the stop-loss once price exceeds it. Entries should be laddered in around the levels closest of the yellow line.
This trading strategy can be applied to any market and time frame, and positions most often garner the greatest risk-to-reward ratio with the highest success rate. What more can you ask for? I will only be posting my unique trading strategy until EOY. I work solely with price action to identify pennants and apply unique trend-based fibonacci retracement levels for SL and TP levels. Reach out to me if you have any questions.
Elliott Wave View Expects More Downside in Exxon Mobil (XOM)Hello Traders,
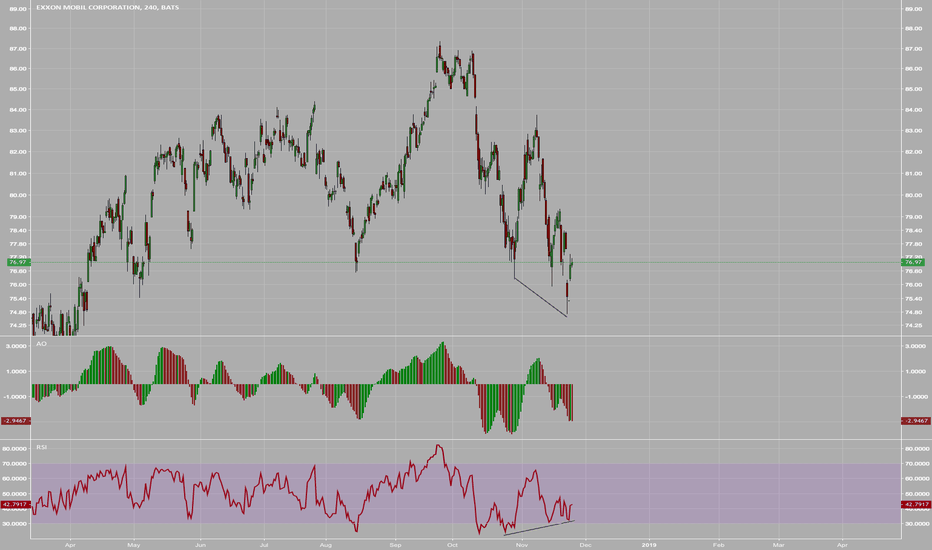
Exxon Mobil (ticker: XOM) has broken below Nov 23 low ($74.7) and opens further downside in the stock with incomplete sequence from Sept 25 high ($87.36). Short Term Elliott Wave view suggests bounce to $81.97 on 12/5 high ended red wave X. Decline from there is unfolding as a double three Elliott Wave structure where black wave ((w)) ended at $74.8. Internal of wave ((w)) unfolded as another double three Elliott Wave structure of a lesser degree. Blue wave (w) of ((w)) ended at $76.92, blue wave (x) of ((w)) ended at $80.36, and blue wave (y) of ((w)) ended at $74.80.
Black wave ((x)) is in progress to correct cycle from 12/5 high as a double three Elliott Wave structure where blue wave (w) of ((x)) ended at $77.77 and can have ended blue wave (x) pullback at 75.68 low. We expect another leg higher to complete blue wave (y) of ((x)) of the double three pattern before the stock resumes lower. We expect sellers to appear and rally to fail below $81.97 in 3-7-11 swing for more downside in the stock.
XOM- Back down to 2015 prices. Great Dividend investmentI'm always on the lookout for good dividend investments The energy sector is catching hell right now and it may be a good time to revisit some of the equities on the watch list For my dividend stocks I like to go back atleast 5 years to see trends. This may be a good time to snatch up Exxon. It has a very attractive dividend as well.
Plastic: The New TobaccoToday up for aution we have... war era industrial Crude Oil vs the 90% efficient and the downsizers
strong sell on Oil.
massive future oversupply expected and increasing money costs make oil and oil expanding ventures very weak
cannabis plastics will replace crude oil plastics eventually causing more downside for this industry
Eat organic pizza. always filter water.
Sell XOMDaily quasi bearish three/falling three method
As well bearish fakey, with gravestone doji harami pattern for the past to days...
4 hour tweezer top, to confirm bearish bias for daily short...
MACD showing negative trend patterns
Stoch heading to oversold range
Raymond James downgrade 11/20/18
ATR 1.73
S/L 79.04
T/P 74.44
R/R 1.96
Profit Trading!


