XLM:BTC UptrendWill this be finally the time we break that pesky 0.000012 resistance?
I think so.
XLM:BTC is in a clear uptrend channel and a large ascending triangle has formed which is a bullish signal.
(not trading advice, I'm not your financial advisor, do your own due diligence)
XLMBTC trade ideas

Stellar Bullish movestill not 100% sure of it. it's better wait until price reclaims midrange
whales bought big amount a few weeks ago and we all know they're not in profit right now, I'll expect at least 3X for XLM

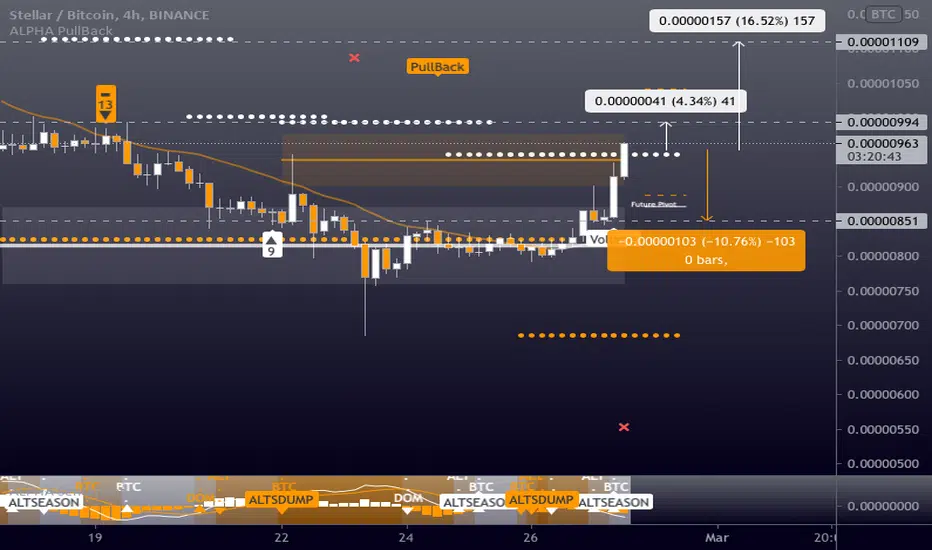
XLMBTC - Long - Potential 16.52%XLMBTC - Long - Potential 16.52%
Entry- 958
TP1- 994
TP2- 1109
SL- 851
- Trigger - Volume
- BTC - Alts Recovering - Manage Trade As BTC Rejection Possible
- RR - 1.4
- Trailing Buy - 1%
- Trailing Profit - 1%
- Trailing Stop-Loss - no
XLM / BTCXLM still hasnt broken from accumulation starting in July 2019 , the pump will be massive just like ADA

Pour Me a Cup of XLM/BTC #Stellar #Xlm $XLM Here we see our weekly XLM BTC chart from Binance . As you see XLM had massive downside right through that bear market in 2019. It looks quite clearly like a massive Cup structure has formed .You see we've started to come up a bit now from the recent bottom . We're even wicking into the weekly Ichimoku cloud - I wouldn't be surprised if XLM closed a candle inside the weekly Ichimoku cloud - and soon. And that would be bullish . Once we close a candle inside the Ichimoku here we will almost certainly go to the top of that cloud near 2500 . And after that we should be breaking upwards out of that cloud. Targets at that point would be the fibs such as :
the .50 fib near 3616
the .618 fib near 4375
the .706 fib near 4939
but at that point XLM might just enter price discovery mode since our last weekly resistance is near 4500 sats. Will be an interesting 12 months
ahead for XLM. Hope you're having a great day . Keep in mind Cup and handle structures always have a pullback after forming the top part of that cup ( for us that's up near 3700 it looks like) and then they pullback a bit forming the handle before more upside .

XLM formed Gartley for upto 29% moveHi dear friends, hope you are well and welcome to the new update on Stellar.
On the 4-hour chart, the priceline of XLM with Bitcoin pair has completed the formation of bullish Gartley pattern and entered the potential reversal zone. There is also 200 simple moving average support below the buying zone.
This trade has a huge profit possibility up to 29%, and the loss possibility is 7.5%.
Note: Above idea is for educational purpose only. It is advised to diversify and strictly follow the stop loss, and don't get stuck with trade.


XLMBTC wants the breakout 🦐XLMBTC wants the breakout from the descending channel. If the price will have a breakout and flip the current resistance into new support, According to Plancton's strategy (check our Academy), we can set a nice order
–––––
Follow the Shrimp 🦐
Keep in mind.
🟣 Purple structure -> Monthly structure.
🔴 Red structure -> Weekly structure.
🔵 Blue structure -> Daily structure.
🟡 Yellow structure -> 4h structure.
⚫️ Black structure -> <4h structure.
Here is the Plancton0618 technical analysis, please comment below if you have any question.
The ENTRY in the market will be taken only if the condition of the Plancton0618 strategy will trigger.


XLM (Stellar Lumens) - bounce incoming?XLM has completed a retracement to 0.786 fib. This is typically a very strong area of support.
The price is currently sitting in the golden pocket, between 0.618-0.65 fib which is also a good area to see a bounce.
If the price can hold above these area, then expect it to move towards the green box for >50% increase.
If it cannot hold these fib levels then it will likely break down further and move towards the red boxes 35% decrease.
Note the lower red box lines up with 1.618 fib level and as such is a stronger level of support.

XLM completing BAT for upto 35% profit moveHi dear friends, hope you are well and welcome to the new update on Stellar.
On a small time period 4-hr chart, the price action of the XLM is completing the final leg of bullish BAT and soon it will be entered the potential reversal zone.
This trade has profit possibility of 35% and the loss possibility is only 5%
Note: Above idea is for educational purpose only. It is advised to diversify and strictly follow the stop loss, and don't get stuck with trade

XLMBTC possible scenarioWe want to see a break above the triangle and retest (clear bounce) of the upper boundery before entering.
What do you think, will we break above to more upside? Let me know in the comment section!

Stellar Lumens (XLM) Next Target MappedThe candles are pointing up/printing green for Stellar Lumens, XLMBTC.
We will keep this one short.
The light green dashed lines are the projected targets.
This is where prices should hit on the next jump.
The green space below the current price is for support.
This level is where XLMBTC looks for support if prices drop.
This is not financial advice.
Make sure to do your own research before trading.
I am wishing you the best always.
Thanks a lot for your continued support.
Namaste.

Same same for Stellar LumensPotential BUEC, just waiting for a SOS bar that will confirm the uptrend.
Cheers.


XLMBTC ascending triangle looking greatWent long on Stellar at 902. Chart looks great! Lets see how it plays out!
NOT financial advise DYOR


XLM - finally salvationXLM was not fun in the last weeks or even months. But here we go... It shows some decent bullish signals!
Price above EMA50 weekly is a very good indicator
Volume after bottom suggests we're loading up!
RSI is looking yummi!
There you go, as requested in the comments


this is big for xlmon the weekly timeframe
we can see xlm trying to break out of the triangle
if this confirm, it is a massive potential up for xlm against btc

How to... StarDust 🌟Upside legs on xlm to R1 / R2 and above, with XBT targets. USD chart in discovery mode... let it roam, whatevs.
Buy pressure on both sides pushing up, same visible on 1d.
Struggling to sell some because "they" tell you it's "bad" to sell?
Don't mix morals with millions, the market wont pay you to be a martyr.
Emotionally attached to a project/asset?
Congratulations, you're human. If it's really an asset and not liability, it'll carry its own weight.... i.e. pay for itself.
Figure out what price needs to be for you to recoup total initial cost + 20%, with only a third of your initial position size... then you can hold hands with the rest, forever.
Looking for trade signals/trade groups/training programs that teach you how to make $5,000,000 a day??
There's plenty of em. Some free, some not, some just shameless. If all it took to be a successful trader was to be "taught," then everyone would just take a course and get minted.
That's not how it works, and you know that.
Your successes and your failures are yours. Take joy in that 😎
Appreciate the risk.

