resistance testing + ascending triangleNot a trade advice
hey guys, here is my analyse view about this coin
as we can see it is forming a a ascending triangle pattern and also testing a big resistance
if resistance break we can set a possible order
any comments or other point of view let me know
good trades to all of you
XLMBTC trade ideas

XLM big volume spikes (150% profit with R:R 4 setup)As XLM/USD is reaching its target Im searching for a new opportunity.
Our 300% Gains from R:R 16 setup are almost done but ! XLM looks ready to go higher
It looks to me like a break out of MA and retest of it is just happening. So this could bring a solid opportunity to increase your BTC bag by 150% with R:R 4 setup on XLM/BTC pair
XLM dont want to dive .. it wants to touch the sky and sun
ChaChain
-------------
Disclaimer:
I´m not registered or licensed in any jurisdiction whatsoever to provide investing advice or anything of an advisory or consultancy nature, and therefore I´m unqualified to give investment recommendations. Always do your own research and consult with a licensed investment professional before investing. This communication is never to be used as the basis of making investment decisions, and it is for entertainment purposes only.
KEYWORDS
trading, bitcoin , bitcointrading, profitable trading, profittrading, profit trading, secret, divergence, bull divergence, bear divergence, divergencetrading, divergence trading, trading strategy, how to trade bitcoin , bitcoin trades, bitcoin trading, make profit, take profit, trading strategy, trading technique, successful, successful trader, successful technique, successful strategy, successful secret, how to trade, trend analysis, technical analysis , indicators, rsi , relative strenght index, let it rain, successful life, easy strategy, easy trading, easy technique, make money, crypto investing, investing, crypto, cryptocurrency, cryptocurrencies, mentoring, money, chartart, beyond technical analysis

XLM LongXLM is trying/near to breakout
BTC is up 15% since Tesla announcement
ALT coins rushing to FOMO on BTC
BTC will flow back to coins like this when BTC FOMO is over
XLM and ETH and AAVE are my bets to benefit from FOMO redistribution

XLM/BTC Why I'm super Bullish!Note this BTC Pairing, USDT and BTC Will Move in Unison with each other, Chart will look similar but Different. Notice we are very Close to a weekly MA Cross on the BTC Pairing. Notice we are trading at very very low levels when it comes to the BTC Pairing. Guys this is just getting started, the more i look at it I wonder where price will Go. It's Beautiful! Good luck trading!

Stellar Still Bullish (XLM)XLMBTC (Stellar) continues to look good as its prices remain above EMA10 and all other EMAs on this chart.
The trading volume is low, this is a short consolidation phase with a strong bullish bias.
A strong bullish breakout can develop anytime.
The next target is marked on the chart.
The green space is for support. Below this level, XLMBTC goes bearish short-term.
Namaste.

XLMBTC 15MIN BULLISH DIVERGENCE, LONG TRADETARGET 1650 SATOSHIS
TRENDLINE SUPPORT
20EMA DAILY SUPPORT
HORIZONTAL SUPPORT AT CURRENT PRICE


XLMBTC is trying to have a breakout 🦐$XLM.X is trying to have a new breakout from 4h resistance and the price is testing 1d as a support. If the price will have a breakout, According to Plancton's strategy (check our Academy), we can set a nice order
–––––
Follow the Shrimp 🦐
Keep in mind.
🟣 Purple structure -> Monthly structure.
🔴 Red structure -> Weekly structure.
🔵 Blue structure -> Daily structure.
🟡 Yellow structure -> 4h structure.
⚫️ Black structure -> <4h structure.
Here is the Plancton0618 technical analysis, please comment below if you have any question.
The ENTRY in the market will be taken only if the condition of the Plancton0618 strategy will trigger.

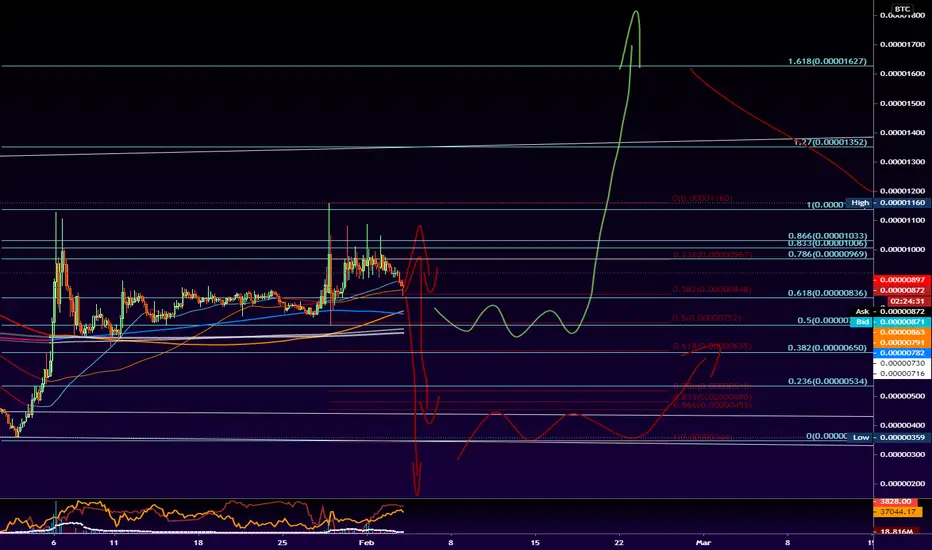
XLM/BTC ST (February 4th 2021)Stellar Lumens (XLM)/BTC rate (February 4th 2021 through February 25th 2021)
Low: 0.00000344 - 0.00000449 - 0.00000709 BTC
High: 0.00000709 - 0.00001352 - 0.00001627 BTC
Haven't taken a look at XLM in a long while. I'm seeing this very strange pattern show up everywhere and it usually results in some sort of price dump so I guess we'll have to see if this is right. It could be very wrong, but I took a look for my Cindicator forecasts.
These are just some ideas of different variations of patterns/paths I expect could follow soon.
Thanks for tuning in :) Disclaimer, anyone in the trade needs to do their own due diligence and decide what is right for YOU. My charts can be wrong at any time and it's very important that you have your own strategies and plans in place. I run this channel for my own educational purposes of learning to trade, and I will never be 100% right, so please do not let me confirm any bias for you! (Dangerous to do so, stay safe and remember the basics & rules of risk assessment.) Expect the unexpected and happy trading!
XLM - Lumens Breaking Out Beyond Resistance, Get Ready!Taking a look at the price action on the weekly timeframe, I've been noticing the bullish price action occurring over the past few months. The price has been primarily contained below the 800sat level since July 2019. Any breakouts beyond this level were only temporary and eventually were pushed back below this resistance level by sell-side pressure. However, not only has XLM broken out beyond this 800sat level, but it could be breaking out of a very large falling wedge pattern (which is more evident on the smaller time frames like the daily). Weekly MACD and OBV indicators turned very bullish and volume has been steadily rising since November of last year, which could indicate that a major move is about to happen.
With XRP on the sidelines as a result of the filing of the SEC Complaint, Lumens has the potential to position itself as a major player in the global financial market. For my portfolio, I will be making a long position here because I see a lot of upside at these levels.


XLM/BTC daily chart long position #XLX/BTC daily chart long position buy in red box.... best entry in yellow line...... SL: 0.00000768..... TARGET : green lines 👉🏻@merlincryptogroup👈🏻

XLM - Ascending TriangleTaking a closer look at XLM, the 1H is looking great. We are currently in an ascending channel with a great chance of breaking above resistance around 990 sats. Currently still sitting on our 940 entry for the other chart, I can see us hitting 990 sats within the next 24 hours. From there the targets are still 990 - 1,100 - 1,300. Good luck my fellow traders!

XLM - One More RunLooking at the daily chart on XLM/BTC, it looks like we have one more good run left in us. I am making a risk trade to ride this for a good 10-20% profit since the data looks good. Doing a fib retracement of the last pump I am setting my targets at those levels of 980 - 1,100 - 1,300 sats. I will be entering here at 940 sats. Setting a stop loss at 915 - a close one in case there is a crash due to Bitcoin's current volatile movement. Good luck traders!


XLM Fib timezones and targetsJust a quick study based on the current periodic spikes. Considering major trendlines and the most prominent fib retracement.

XLMBTC - Long - Potential 10.68%XLMBTC - Long - Potential 10.68%
Entry- 989
TP1- 1037
TP2- 1098
SL- 932
- Key Notes - BTC PRICE STABLE, DOM DOWN = ALTS INCREASE
- RR - 1.78
- Trailing Buy - 1%
- Trailing Profit - 1%
- Trailing Stop-Loss - no

XLM breakout?XLM leaving his triangle and going for the first resistance, if it breaks there's a nice profit ahead.


Time to make stellar performance again XLM!Looking at the longer term development helps to put the recent price action into perspective. XLMBTC has actually moved back and forth across the old downward sloping trendline that originates from June 2019. That trendline now coincides with a strong support/resistance against which XLM is presently forming an ascending triangle. That can be seen better from the 12h chart below.
Last November there was a tremendeous impuls to the upside all the way to 1200 sats level. After that started a strong correction, while BTC was making a strong move up, taking XLM all the way down to 400 sats level. From that bottom on 3 Jan XLM has recovered to the present level, back to the 840-880 strong S/R zone.
In December XLM broke from that S/R zone downward after creating a descending triangle. Now it is completing an ascending triangle that most often breaks upward. I am holding XLM and buying more if that breakout takes place with a good volume. Tell me what you have concluded based on your research.
Trade safe and take care.
Cheers
Whoop

Resistance Area For XLMBTC /w Ascending Triangle ?It more looks like we're currently getting an ascending triangle with a resistnace area on top with higher lows.
MACD cooling of and arround 0.
Ascending triangles are a bullish pattern, so in my guess and with what's currently going on we'll get a break to the upside.
No Financial advise do your own research.
