Stellar, a coin to watch in this ALT SEASON !!! #XLMBTCWelcome to my update:
As all of us may have noticed till now, we are in the alt season.
But what coins are valuable and +100X during this bull run?!
- Any coin that has created higher lows since 2019 is considered a promising one.
- Coins with a high market cap ( just check the top 20 and pick those that have a green chart)
- Coins with strong fundamental news around them.
- XLMBTC :)
.$STELLAR has created bullish divergence o RSI indicator, on weekly and daily time frames !!!!
.The volume has increased magnificently since Nov 2020.
.It is in the top 10 of the high market caps, with $6,357,600,985.
.It is currently trading above its crucial support area and
.Great news about them
.Grayscale has doubled their holding of this coin lately
So both fundamentally and technically, $XLM is in a great spot to be bought.
My first target is 2143 satoshis
My third target would be the 0.61 fibo level (3128 satoshis)
And the last target is 7275 satoshis
Feel free to share your own insight of this pair, and please hit the like button and support my idea if you want this coin to moons in this bull run.
XLMBTC trade ideas


Stellar - target $0.8 for next movewant to see above .33 previous high and breakout and btc and USD
looking good so far
not financial advice


BINANCE: XLM/BTC🛒 Pair: XLM/BTC 🛒
== SPOT==
⏰ 1399/10/27 ⏰
🕰 16/01/2021 🕰
Duration:
📈 SHORT - MID 📈
Ex: Binance
#20
🛒 Buy : 790 - 800 🛒
👉Sell Targets👈
🎯TP1: 845 🥉
🎯TP2: hidden🥈
🎯TP3: hidden🥇
🎯TP4: hidden🏆
🎯TP5: hidden🚁
🎯TP6: hidden✈️
🎯TP7: hidden🚀
🎯TP8: hidden🛰
⛔️ SL: 730 By closing **4hrs.** candle below

XLMBTC Symtrical TriangleSoon Breakout To Come IMO.
With on RSI a Bullish divergence, and forming a local double bottom pattern.
Having a consolidation after our pump to the upside, giving us more and more ways to believe that we'll stay in the current uptrend we're setting.
If we would have a same amount of percentage gain. We would reach arround 1800 Sats with a minimum of 1600 Sats as our target.
Not Financial Advise Do Your Own Research, GL HF Trading And Making Gains.

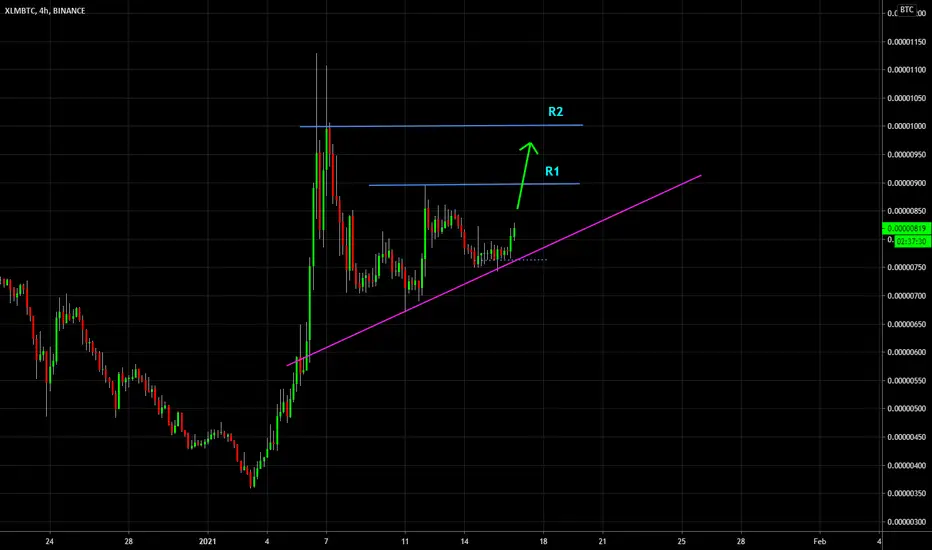
XLM/BTC Is Gaining Strength: Bullish OutlookXLM/BTC has gained a lot of ground recently. After a few days of quiet, I see that price action and volume are picking up again.
On the chart I've marked two areas of potential resistance, R1 and R2, based at recent highs. Happy trading!

XLMBTC is testing Monthly resistance 🦐$XLM.X if the price will have a breakout from monthly and retest as new support the daily resistance, According to Plancton's strategy (check our Academy), we can set a nice order
–––––
Follow the Shrimp 🦐
Keep in mind.
🟣 Purple structure -> Monthly structure.
🔴 Red structure -> Weekly structure.
🔵 Blue structure -> Daily structure.
🟡 Yellow structure -> 4h structure.
⚫️ Black structure -> <4h structure.
Here is the Plancton0618 technical analysis, please comment below if you have any question.
The ENTRY in the market will be taken only if the condition of the Plancton0618 strategy will trigger.

$XLM BTC new price rally ahead?XLM, in my opinion, belongs to the top 3 cryptos.
It is decentralised, robust and has a high speed. Recently chosen by the Ukrainian government also after 3-year evaluation as a platform to build their national currency. So I'm strongly bullish for Stellar $XLM, and my analysis might be biased while I try to keep this neutral.
Why is XLM bullish?
1. H8 XLM break into a bullish zone which according to Ichimoku_Cloud indicator (Enhanced for Crypto due to 24/7 activity) read more of this tool by a recent post from @entertheroach The-Ichimoku-Cloud-Ichimoku-Kinko-Hyo-WTF-is-it/
2. H4 and all smaller timeline charts complete a new flag in the chart indicating new burst.
3. Ichimoku_Cloud indicator in H4 is showing strong support just below H4 flag, indicating a new bullish breakout
4. In H4 EMA20 and MA50 recently crossed well over MA200 indicating the bullish cycle
5. EMA20 and MA50 has not crossed in H4 indicating the flag will burst into a new price rally.
Apart from chart analysis with recent positive news on $XLM, bitcoin price rally and above-mentioned indicators, there is a high likelihood to see a big price rally for $XLM similar to 10 days back. It increased 152% in the last rally from the bottom. Thus, the target now is another 150% from the last bottom, 121% from the current price level, which is ambitious, while well deserved for $XLM in my opinion.

Stellar XLMUSD bullishlike the look of it. few swing trade ideas if we break some of these resistances. very nice if we get over 1.15 usd
not financial advice


XLMBTC 7/77 MA Crossover!7day crossing up through 77day (white/blue) so you know what that means?
950🎯

XLMBTC 7/77 Crossover7Day crossing up through 77day (white/blue) so you know what that means?
950target 🎯


Update XLM (Stellar Lumens) BTC - Zoom in 15m - Looks goodZoom in 15 minutes.
A bullish looking setup with the ma50 now acting as strong support. Ma20 is probably going to stay above the ma50 and imho all systems are go to attack that so important 0.000012 level again. MOON is above that, but let's take it step by step from here. I rather don't see price trade below the ma50 very short term (except for a spike candle which is reverted asap), that's a serious warning sign I have it wrong. That this idea wasn't a good idea at all...
Note that -- as on so many occasions - the confluence between (relatively) 'flat' Bollinger Bands and the Ma50 gives great entries. If you are in from there, you are safe whatever may happen. You don't let that turn into a (big) loser, stops near entry. Trading from the sofa. It works on all timeframes, and the 15 minutes makes no exception. The latter is therefore really suited for daytrades or trades with a 2-3 days scope, or as a zoomed in entry within the scope a larger idea/longer term trade.
There is something more to it to explain though, it's not all that simple sadly, and I will try to work that out in a more elaborate idea later.
Safe trading and meet you in the comment section if XLM is a crypto you (want to) trade or HODL!


💡Don't miss the great buy opportunity in XLMBTCTrading suggestion:
". There is a possibility of temporary retracement to suggested support line (0.0000057).
. if so, traders can set orders based on Price Action and expect to reach short-term targets."
Technical analysis:
. Stellar/Bitcoin is in a range bound and the beginning of uptrend is expected.
. The price is above the 21-Day WEMA which acts as a dynamic support.
. The RSI is at 54.
Take Profits:
TP1= @ 0.0000113
TP2= @ 0.0000136
TP3= @ 0.0000167
TP4= @ 0.0000198
TP5= @ 0.0000293
SL= Break below S2
❤️ If you find this helpful and want more FREE forecasts in TradingView
. . . . . Please show your support back,
. . . . . . . . Hit the 👍 LIKE button,
. . . . . . . . . . . Drop some feedback below in the comment!
❤️ Your Support is very much 🙏 appreciated! ❤️
💎 Want us to help you become a better Forex trader ?
Now, It's your turn !
Be sure to leave a comment let us know how you see this opportunity and forecast.
Trade well, ❤️
ForecastCity English Support Team ❤️

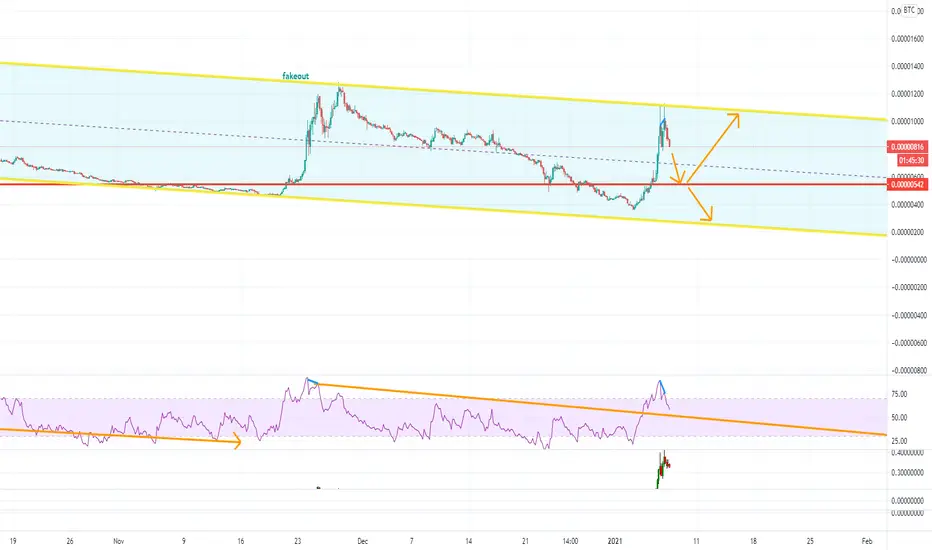
XLM huge volatility but good upside targetsXLM in the last few weks has had massive dumps and rallies vs BTC,
regardless we have yet to see a higher high and looks like some sort of megaphone at the bottom or maybe a fakeout (more likely)
If it breaks above to a higher high, will look to enter longs and take profits at the market resistance points.
Needs a convincing break higher, perhaps this is just waiting for a general alt seasons to kick off