XLMBTC trade ideas

💡 Don't miss the great buy opportunity in Stellar/BitcoinTrading suggestion:
. There is a possibility of temporary retracement to suggested support line (0.0000057). if so, traders can set orders based on Price Action and expect to reach short-term targets.
Technical analysis:
. Stellar/Bitcoin XLMBTC is in a range bound and the beginning of uptrend is expected.
.The price is above the 21-Day WEMA which acts as a dynamic support.
. The RSI is at 62.
Take Profits:
TP1= @ 0.00001170
TP2= @ 0.00001360
TP3= @ 0.00001670
TP4= @ 0.00001980
TP5= @ 0.00002930
SL= Break below S2
❤️ If you find this helpful and want more FREE forecasts in TradingView
. . . . . Please show your support back,
. . . . . . . . Hit the 👍 LIKE button,
. . . . . . . . . . . Drop some feedback below in the comment!
❤️ Your Support is very much 🙏 appreciated! ❤️
💎 Want us to help you become a better Forex trader ?
Now, It's your turn !
Be sure to leave a comment let us know how do you see this opportunity and forecast.
Trade well, ❤️
ForecastCity English Support Team ❤️

XLM BTC 4h ZOOM outChart speaks for itself. Harmony in play big time. MOON in play. Above 0.000012 we don't need rocket fuel anymore, we are free flowing.

Stellar (XLM) Going Strong, Targets & More (Click here...✅)Just like it happened in late November, Stellar (XLMBTC) is now moving very strong.
Today its prices move simultaneously above EMA300, EMA200, EMA100, EMA50, EMA21, and MA200... These levels tend to work as strong resistance.
And just like we saw back in November, above them we can see even stronger growth.
The chart here is very simple:
1) If prices stay/close above this level, we can expect more up (straight up).
2) But if instead, we see a retrace, we will have consolidation before going up again.
Right now it looks like straight-up is the case.
The potential targets are marked on the chart.
Namaste.

Update breakout XLM (Stellar Lumens) BTC 4h chartMy first idea posted on January, 1 was about the possibility of an upwards move of XLM versus BTC.
As you can see, that upwards move has materialized, after a tiny final wave down towards the same support has occurred.
We subsequently broke out of the wedge like pattern and accelerated towards the first resistance zone. Where we are now, you see on the chart multiple indications of possible resistance.
I would personally let winning positions run, (unless the setup of your trade of course was that one of a short term trade, with the target reached). Adding new positions at this spot, that's another story. I expect things to work out bullish, with more upwards action to come (after some consolidation, retrace?), but I should need to see more reference points before acting upon that. Feel free to ask info or just interact in the comment section.


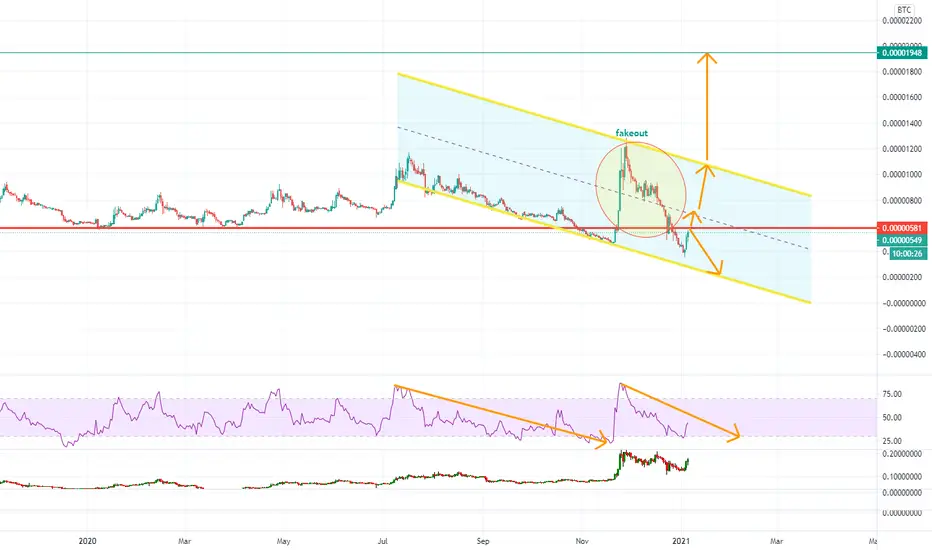
XLMBTC testing historical support turned resistanceSecond time it dropped under historical support after making a big fakeout above it. This is very bearish and rejection at resistance will send it a minimum of 60% down.
I favor a drop because price action is similar to July to October.
XLM \ BTC AnalysisAs we can see, there is good support. I expect to grow well after overcoming resistance


XLM / BTCTook XLM / BTC into log scale & added more time and we can see what the future holds.
1 thing is for certain BTC will most likely continue to climb into 2021 and any dips & pull back will not be a bear market.
So we can assume that we r in a full blown bull market now since May 2020 IMO.
The question is where does BTC top. Most analysis I respect point to a top around $190k.
So If history repeats itself we should see XLM (And all Altcoins) follow a similar path, that path is 18 months from bottom of the range until top of the range.
I have outlined the top of the range with different price targets I strongly believe we will have 6 months over 2021 where BTC will continue to push higher until finally peak is reach sometime this year, If that peak is reach B4 summer than we have our alt coin targets if that peak is reach by end of 2021 then our alt coin targets will be much higher ;).
So the idea is that soon BTC.D will push higher and keep alts under pressure, maybe even 81% BTC.D this will bring the peak in BTC price.
Then Dominance will have small & large corrections in the bull market. This will allow alts to play catch up.
So any and all dips for the next year are strictly for buying and no selling your alt coins until sub 40% BTC.D is allowed by anyone following my analysis or the gods of crypto will fomo you back in at higher prices all year.

XLM/BTCSome levels of interest where I will be looking to sell when the opportunity comes around. ;)

XLM (Stellar Lumens) on the way to make an upwards move?XLM BTC chart (4h) looks like a setup that can be played on the long side, certainly when 0.00000500 should be broken (breach of the purple resistance line acts as confirmation). 4h Bollingerbands could prove to be (temporary) resistance (possibly in confluence with that purple line). The chart speaks for itself I suppose. The red lines (under) show where support can be expected when no upwards break occurs, or when it works out to be a fake one.
A fake break-out (an initial move out of the wedge like pattern, which is subsequently reverted) can never be ruled out, so timing of the entry should preferably be managed through analyzing the lower timeframes. RSI divergence supports the possibility of a bullish move. A logical target is 0.00000700, previous resistance/top of December 25, 2020. Note that the upper line of a parallel channel could prove to be resistance as well.
My first idea on Tradingview, so I will probably struggle with how exactly to bring them in the beginning.

XLM at last support Stellar is the hardfork of XRP. The XRP SEC thing is affecting the price of XLM also. XLM is now at the last support zone. This is only TA-based trade and you must have a stop loss as if XRP dumps more we see more dump in XLM too.
Buy zone: 460-470
Target: 525-570-630-695-770-850-930
Stop Loss: 420

xlmbtcXLM near bottom could double bottom happen.... daily chart vs BTC
stop loss below : 0.000000440

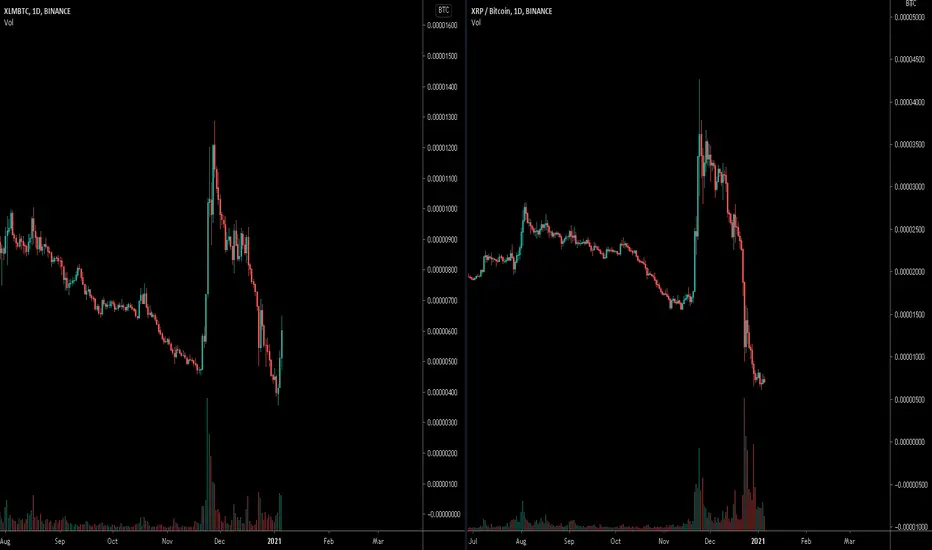
Are you ready for biggest short squeeze in crypto world?!The chart is showing XLMBTC vs. XRPBTC. XRP will got to the hell, but XLM will teach a good lesson to shorters.

Stellar even follows the SEC news that XRP received lol..Stellar even follows the SEC news that XRP received lol..
When uncorrelated?


XLMBTC is inside a triangle 🦐XLMBTC is inside a triangle, and the price is testing monthly support. IF and only IF the price will lose the support and turn into new resistance, According to Plancton's strategy (check our Academy), we can set a nice order
–––––
Follow the Shrimp 🦐
Keep in mind.
🟣 Purple structure -> Monthly structure.
🔴 Red structure -> Weekly structure.
🔵 Blue structure -> Daily structure.
🟡 Yellow structure -> 4h structure.
⚫️ Black structure -> <4h structure.
Here is the Plancton0618 technical analysis, please comment below if you have any question.
The ENTRY in the market will be taken only if the condition of the Plancton0618 strategy will trigger.

XLMBTC - Decision TimeXLM has been consolidating.
Seems to be drifting bullish on MACD.
Buy target around 858 sat, and then see what happens around 915 sats, to see if it breaks out of the triangle.
First target ~950sats

xlmbtcAfter correction of Bitcoin, we have to watch some coins such as xlm which want to break long time break, watch it, and buy in the proper position. in my opinion, it will goes lower more than what is it now.

XLM reversal?XLM showing signs of an uptrend.
On 30 minutes chart, there are some bullish signals, now we are waiting that those signals also confirms on hourly chart.
If blue line crosses maroon line and if candles break through the cloud, then we can expect 1000 sats in a couple of days.
The yellow rectangle represents kumo cloud on 4h chart. If todays price closes around 900 sats, than we are going toward 1000 sats, based on ichimoku cloud principles.
RSI is showing an uptrend on 30min,1h,4h, 1d
