XLMBTC trade ideas

XLMBTC D1: Best level to BUY 40% gains BUY/HOLD(SL/TP)(NEW)Why get subbed to to me on Tradingview?
-TOP author on TradingView
-15+ years experience in markets
-Professional chart break downs
-Supply/Demand Zones
-TD9 counts / combo review
-Key S/R levels
-No junk on my charts
-Frequent updates
-Covering FX/crypto/US stocks
-24/7 uptime so constant updates
XLMBTC D1: Best level to BUY 40% gains BUY/HOLD(SL/TP)(NEW)
IMPORTANT NOTE: speculative setup. do your own
due dill. use STOP LOSS. don't overleverage.
Tagged as SHORT because I expect more short-term
and losses before reversal.
🔸 Summary and potential trade setup
::: XLMUSD daily chart review/outlook
::: tagged SHORT because it's BEARISH short-term
::: will flip into BULL MODE later
::: BEST LEVEL TO BUY near 600 sats
::: it's key S/R from the past
::: TP bulls is 40% gains in this trade
::: bulls will target re-test of mirror S/R
::: TP1 is 800 sats TP2 is 900 sats
::: get ready to BUY LOW and get paid
::: recommended strategy: BUY LOW 600 sats
::: TP BULLS is 40% gains BUY/HOLD setup
::: SWING trade setup / no fast gains here
::: BUY/HOLD / do not expect miracle gains
::: SL is 5% max
::: good luck traders!
🔸 Supply/Demand Zones
::: N/A
::: N/A
🔸 Other noteworthy technicals/fundies
::: TD9/Combo update: N/A
::: Sentiment mid-term: BULLS/REVERSAL
::: Sentiment outlook short-term: BEARS

Time for XLM to Moon?** This is by no means professional advice. I've just started learning TA and this is my first analysis on TradingView. **
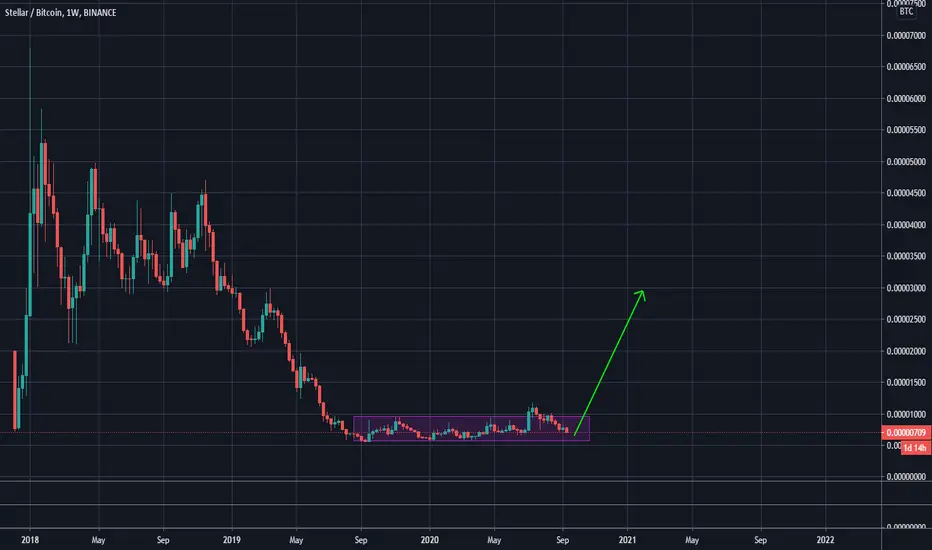
XLM has been in long term accumulation for 52 weeks. If it can hold the 693 level for 2 more days i.e closing the weekly candle above 693, then there is a really good possibility for the coin to shoot up. For Scalping, the Target and Stop Loss is shown by the Risk/Reward Indicator.


$XLMBTC Buying up some here $XLMBTC Buying up some here
STELLAR Scoring
Overall Score: 79.30000000000001%
Open communication channels: 100%
Team strength: 62%
Product strength: 94%
Coin strength: 83%
Business/Company strength: 50%
Brand awareness/Buzz: 100%
Advisory board strength: 100%
Activity on social media: 20%
Quick Research
Purpose: Stellar enables low-cost interbank transfers across coutries in less than 5 seconds. The Stellar Development Foundation is also working to enable access to the financial world for the unbanked.
Product Status: Fully working product
Consensus Method: Stellar Consensus Protocol
Emission rate: Emitted in proportion to amount of network activity
TXN'p/s: 1000
Abstract:
Stellar (XLM) is a completely decentralized consensus platform. It is designed to support any type of currency. It has a built in decentralized exchange that can be used to trade any type of currency or asset.
Investment data
Listed on 70 exchanges
CoinMarketCap Rank: 10
Market Cap: $2 B
24H Volume: $669 M
Coin Age: 63 months

XLM/BTC- ATS SCALP BACKTESTScript settings for 6H timeframe:
· Signal calculation type - "high"
-TP for Long - 6%
-SL for Long - 3%
-TP for Short - 6%
-SL for Short - none

XLM/BTC (Back Inside Consolidation Channel)BINANCE: XLMBTC
-Stellar coin is back inside the horizontal consolidation channel
-It is also trading at the midline support zone
-The middle area is a confluence of previous support and resistance
-If XLM can hold this level for at least 1-2 weeks
-There is a big chance it will try to retest the upper horizontal resistance
-Or even break higher to retest the recent swing top price
``````````````````````````````````````````````
Trading Involves High Risk
Not Financial Advice
Please Exercise Risk Management
``````````````````````````````````````````````
If You Like My Daily Published Ideas
A little Help By Supporting My Channel
Through Leaving A Thumbs Up, Comment & Follow
Happy Trading! --> Thank You! :)
``````````````````````````````````````````````

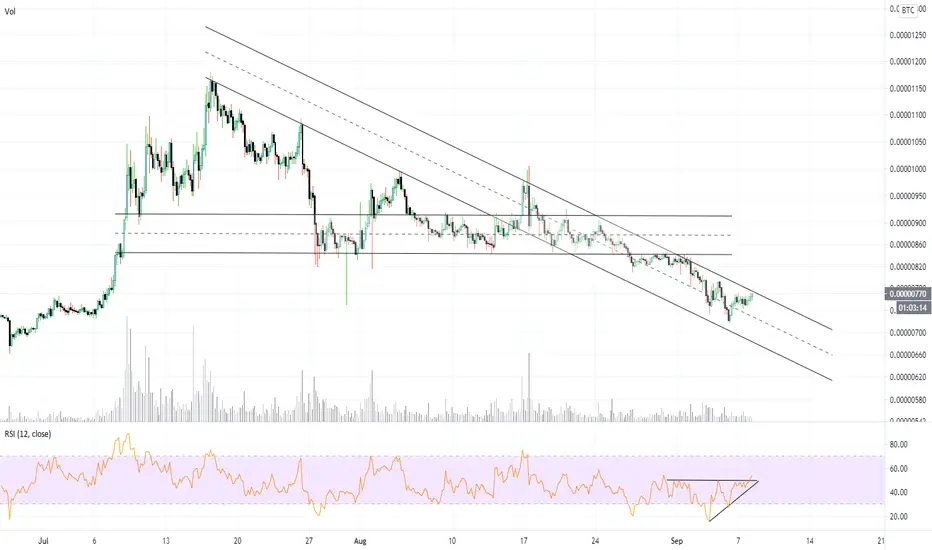
Prepare for lift offXlM's Downtrend is slowly coming to an end as the Volalility increases
Currently with an extremely oversold RSI it opens opportunities for accumulation and possible bullish entries for a 2 month period
Within the following 2 weeks i assume a test of the Major trend resistance and more than likely a break into minor trend resistance


Long XLMXBT Oscillator flashed BUY signal a few days ago, but the EMA of the RSI still had a downward slope so I wanted to wait until it started to turn upwards. Price confirmed bullish bias with a bounce off of a year long support line. SSL has also flipped green. Not looking for a huge move, but I think it's fair to expect to reach the 1ATR level, at which I will lock in 50% profit, move stop to break even, and let the rest run with a trailing stop of 1ATR. The second half usually gets stopped out but at least the position has locked in some profits and leaves some working just in case.

XLMBTC in on weekly dynamic support 🦐XLMBTC in on weekly dynamic support ( previous idea ), and inside a descending daily channel.
IF and only IF the Price will break towards up the channel We can see a nice bull run
According to Plancton's strategy, we can set a nice order
–––––
Follow the Shrimp 🦐
Keep in mind.
🟣 Purple structure -> Monthly structure.
🔴 Red structure -> Weekly structure.
🔵 Blue structure -> Daily structure.
🟡 Yellow structure -> 4h structure.
Here is the Plancton0618 technical analysis, please comment below if you have any question.
The ENTRY in the market will be taken only if the condition of Plancton0618 strategy will trigger.

XLMBTC D1: BEST LEVEL / SHORT IT 20% gains possible(SL/TP)(NEW) Why get subbed to to me on Tradingview?
-TOP author on TradingView
-15+ years experience in markets
-Professional chart break downs
-Premiun content
-not just random lines on the chart
-Supply/Demand Zones
-TD9 counts / combo review
-Key S/R levels
-No junk on my charts
-Frequent updates
-Covering FX/crypto/US stocks
-24/7 uptime so constant updates
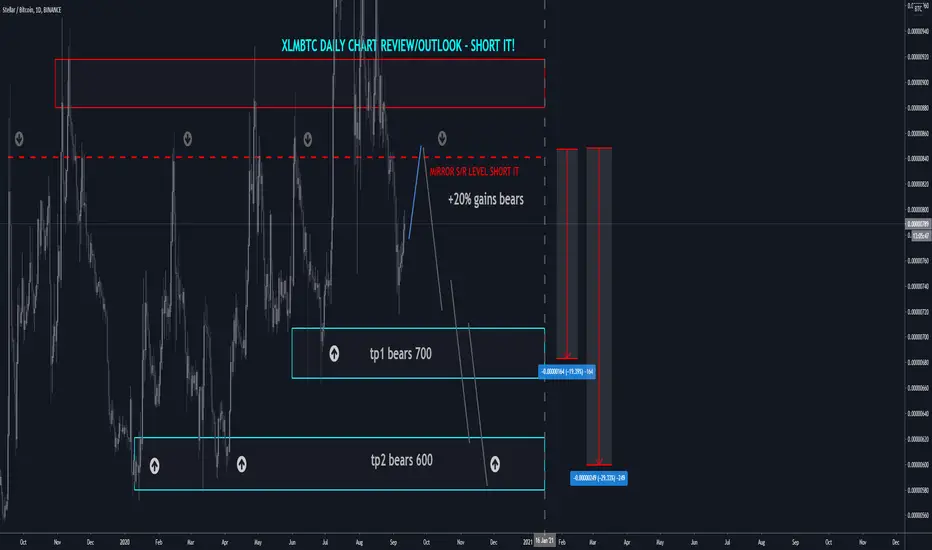
XLMBTC D1: BEST LEVEL / SHORT IT 20% gains possible(SL/TP)(NEW)
IMPORTANT NOTE: speculative setup. do your own
due dill. use STOP LOSS. don't overleverage.
🔸 Summary and potential trade setup
::: XLMBTC daily chart review/outlook
::: 840/850 heavy mirror S/R resistance
::: BEARS will take over from that level
::: get ready to short it and get paid
::: TP1 bears is 700 TP2 bears is 600
::: chart currently transitioning into BEAR
::: mode so just adopt to new strategy
::: let's take it one step at a time though
::: recommended strategy: SHORT IT 840/850
::: TP1 20% gains TP2 30% gains
::: SHORT/HOLD setup / swing tradesetup
::: for patient traders only / no fast gains here
::: re-test of 600/700 required now to complete
::: the sequence for the BEARS
::: Just SHORT IT and you will get paid, period
::: good luck traders
🔸 Supply/Demand Zones
::: N/A
::: N/A
🔸 Other noteworthy technicals/fundies
::: TD9/Combo update: N/A
::: Sentiment mid-term: BEARS/CORRECTION
::: Sentiment outlook short-term: BULLS/RANGE


I love XLM with BTC pairing since 2016 and here is why
Hello everyone,
this is clearly Beyond technical anylsis chart ! and TA doesn´t work and never did !
Right ?
Well if you aren´t that kind of boy then keep reading because I´m charting XLM for some ages now and I must say I really LOVE it !
Longs here arround 0.618 (900-850sat range) should be well rewarded in the short,mid & even long term run
For begginers STOP LOSS highly recommended arround 0.786 fib (786sat - R:R5 for potencial 50% profit visualized) and then adjusting on the way up to lock profits
Would you give a next step and this chart a green thumb up ? :)
If the chart feels too messy to you it is because I highlighted most of important technical informations from basic TA all at one place to make clear how righ tools
and simple patterns can make your work easier, less stresfull, more precise and at the first place more profitable and less risky.
PS: Here is why I´m so passionated towards XLM more and more as the times goes
Majority of my TAs do not take FA into mind just to be clear.
Back in 2017 I made a solid call for XLM I would say
In 2018 I´ve made a update for the same moove
More XLM current situation related charts you can find in related Ideas below
( The acquisition of gradual gathering of something )
** This chart is repost of the idea with some updated visualizations **
What are your thoughts ? Feel free to share them in comments below
ChaChain
-------------
KEYWORDS
XLM , Stellar , trading, bitcoin , bitcointrading, profitable trading, profittrading, profit trading, secret, divergence, bull divergence, bear divergence, divergencetrading, divergence trading, trading strategy, how to trade bitcoin , bitcoin trades, bitcoin trading, make profit, take profit, trading strategy, trading technique, successful, successful trader, successful technique, successful strategy, successful secret, how to trade, trend analysis, technical analysis , indicators, rsi , relative strenght index, let it rain, successful life, easy strategy, easy trading, easy technique, make money, crypto investing, investing, crypto, cryptocurrency, cryptocurrencies, mentoring, money, chartart, beyond technical analysis
-------------
Disclaimer:
I´m not registered or licensed in any jurisdiction whatsoever to provide investing advice or anything of an advisory or consultancy nature, and therefore I´m unqualified to give investment recommendations. Always do your own research and consult with a licensed investment professional before investing. This communication is never to be used as the basis of making investment decisions, and it is for entertainment purposes only.

XLM to re-enter accumulation zone!?On July 1st I advised Learning Crypto Ltd Premium members that XLM/BTC was in an accumulation phase and could be due to make a move up soon, which evidently took place. The accumulation zone occurred between the Weekly Resistance of 880sats and the Monthly Support of 572sats between July 29th 2019 to July 6th 2020!
Since the breakout, which topped out at 1179sats, XLM has been pulling back very aggressively over the last two weeks and is now re-testing 880sats as Weekly Support. If this Support is lost then price would re-enter that accumulation phase it spent a whole year trying to break out of. However, if this Support holds then price would have formed a Higher Low and presents an opportunity to continue the bullish momentum from earlier in the month.

XLM consolidating before a big move up!?In my previous analysis (linked) I spoke about the importance of the 880sats Weekly Support which represents the top of XLM's previous accumulation zone. Price is testing this Support for a 3rd time now, if this level continues to hold and a bullish candle is formed it would confirm a Higher Low on the HTFs. This would be very similar to what occurred on the 703sats Weekly Support just before the most recent move up. Are we about to see a bullish run to test the next Weekly Resistance of 1628sats or will the 880sats level be lost?
