XLMBTC trade ideas


XLMBTC 4D: BEST level to BUY 30% gains.(NEW)Why get subbed to to me on Tradingview?
-TOP author on TradingView
-15+ years experience in markets
-Professional chart break downs
-Supply/Demand Zones
-TD9 counts / combo review
-Key S/R levels
-No junk on my charts
-Frequent updates
-Covering FX/crypto/US stocks
-24/7 uptime so constant updates
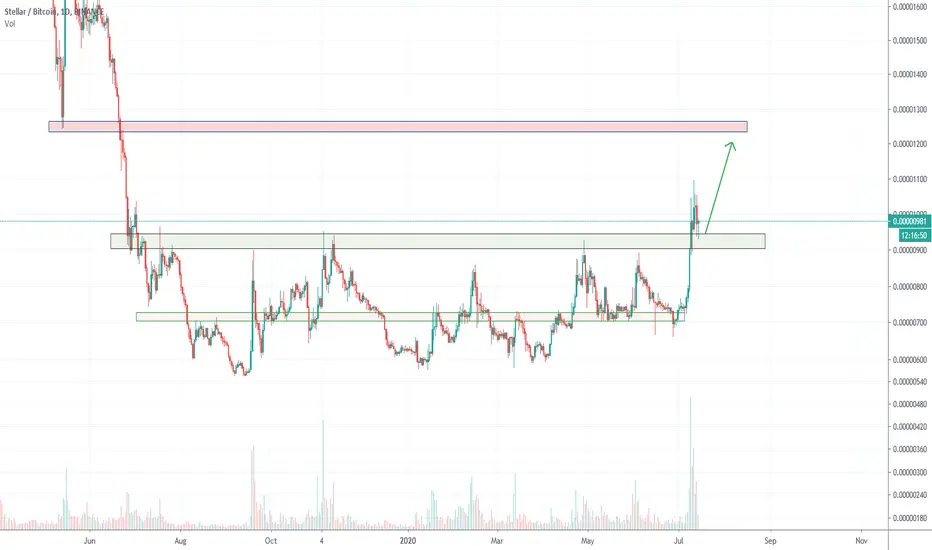
XLMBTC 4D: BEST level to BUY 30% gains.(NEW)
IMPORTANT NOTE: speculative setup. do your own
due dill. use STOP LOSS. don't overleverage.
Hey guys how are you doing today? Before we kickstart
the new update, feel free to review my previous setup
in XLMUSD. click play to recap. 70% gains. TP hit.
🔸 Summary and potential trade setup
::: XLMBTC 4days/candle chart review
::: Speculative bullish setup
::: accumulation / strong bottom pattern
::: strong chart more upside incoming
::: BUY/HOLD setup for patient traders only
::: 30% gains possible from here
::: strategy: BUY/HOLD TP +30% gains 1350
::: market buy and get paid within few weeks
::: TP bulls is 1350 sats
::: good luck traders
🔸 Supply/Demand Zones
::: dem/supp N/A
🔸 Other noteworthy technicals/fundies
::: TD9/Combo update: N/A
::: Sentiment short-term: BULLS
::: Sentiment outlook mid-term: BULLISH


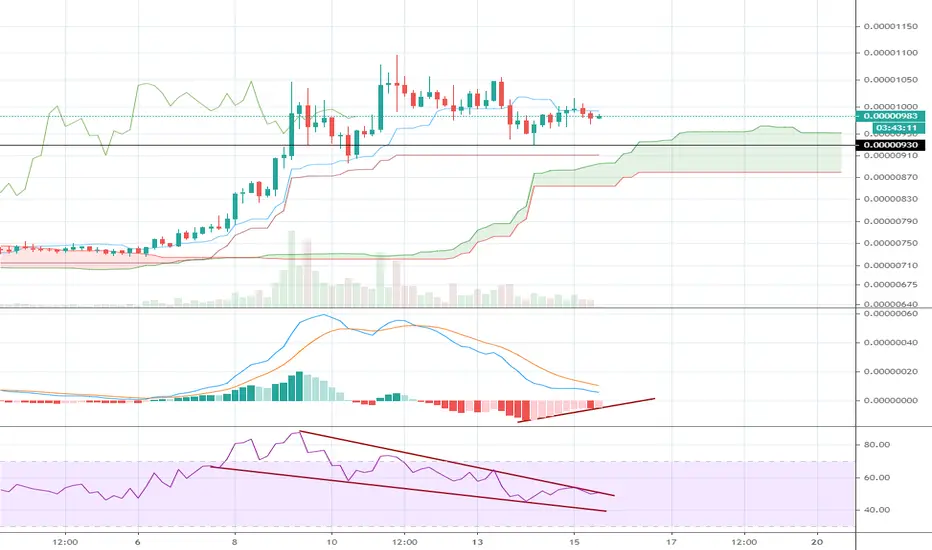
Possible Falling wedgeGood sign of continuation to the upside as the wedge is getting tighter and tighter. MACD histogram is showing strength.
▲ XLM • Stellar • XLMBTC Stellar broke from consolidation range and offering continuous uptrend with solid volumes.
Check link bellow for video version. 👇


XLM.BTC (Y20.P3.E1).Macro structure.BullishHi,
With free time (recently) I like to look across the board and look for potential long opportunities based on key levels and easy to reach structure (trending).
Then if there is a few to chose from, potentially narrow it down to the best options.
I wish I could have a process to track all this once I start doing it, and review regularly. Manually this takes a lot of effort.
What I look for is formation and structure that looks familiar to me, simplicity and I think this one is one of them.
I have not gone through many charts yet and if you look at my recent posts, I have started this process.
Hopefully I will in a short time, maybe this weekend, complete the top 10 or 20 coins.
As for Stellar, one can see the MACRO structure and key points I have placed.
I think XLM against BTC for now, is straight forward.
Cheers,
S.Sari
Daily Chart
4 HRLY Chart

XLMBTCVirtual money has high profits and high RISK. THIS IS NOT AN INVESTMENT PROPOSAL. My personal opinion.

$XLM, Crossing over 1k sats w/ increasing volume & 1D UCTS Buy$XLM
Crossing over 1k sats w/ increasing volume & 1D UCTS Buy signal
Golden cross (EMA50/200, prior cross on September 2018!)
Aiming for an entry as close as possible to this level// R/S Flip as potential confirmation of continuation
If happens, then ~1200sats as target
#XLM

XLM - Lumens Bullish Continuation to the UpsideLumens broke a key level last week at 900sat and hasn't looked back. It appears to be continuing to the upside. There's very little resistance before 1250sat so it might move quickly. I'm long here.


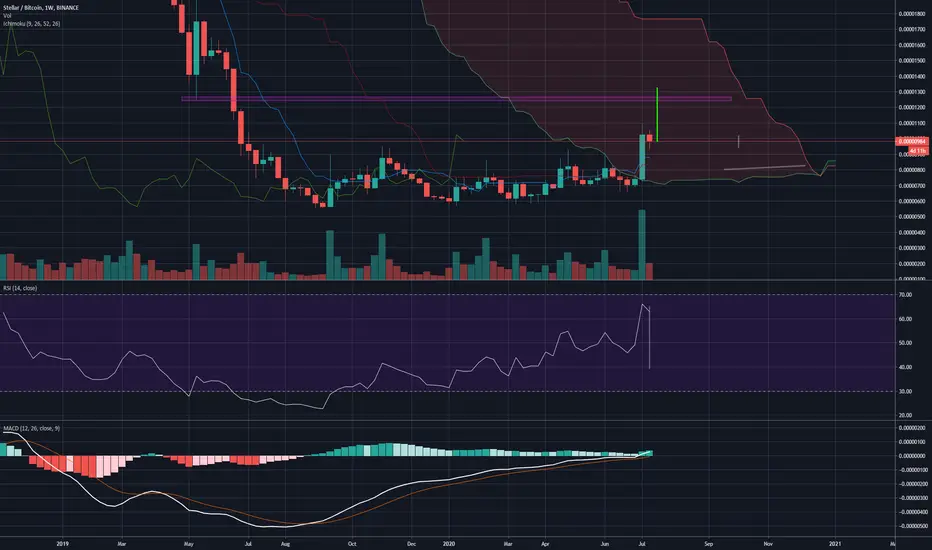
650% ROI IS NOT A DREAMStellar broke its 1 year accumulation range and retested. Still strong and i have position on it. 3 target are at the chart. It's 2 years of investment but will gain back heavily.
Follow for more thanks.

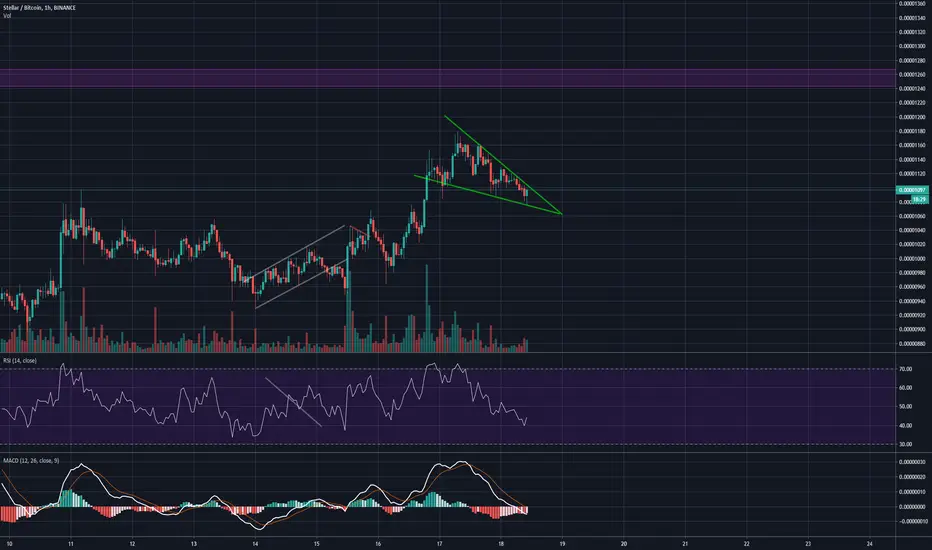
Stellar Lumen XLMForming a bullish symmetrical triangle
I see growth potential up to 1200-1400 satoshi first
Best regards EXCAVO


Could be a MASSIVE 3 bar play on the weeklyAs long as BTC holds it's price relativel steady, stellar can shoot to around 1250-1400 sats. Weekly closed green.
XLMBTCI'm by no means an expert. In my opinion price will continue to rise when looking at 4H chart. Support is respected, Monthly chart MACD crossover as well.
XLMBTC all set for weekly breakoutIf you liked the analysis hit the like button, it always motivate to give best.
XLMBTC after successful daily breakout, things are overbought & bullish.
However looking at weekly chart, it seems the rally is not finished or you can say not yet started.
Weekly breakout above 900 is done, anything above 1000, will take XLMBTC target to 1400+ to 2000+
Its a swing trade call. Hodl for big profits.

Stellar Trading PlanHello Trader,
Stellar dumped to an important support zone and the bulls are showning strenth. It would be a good opportunity for a swingtrade with low risk.
Please push like buttom and follow us on tradingview.
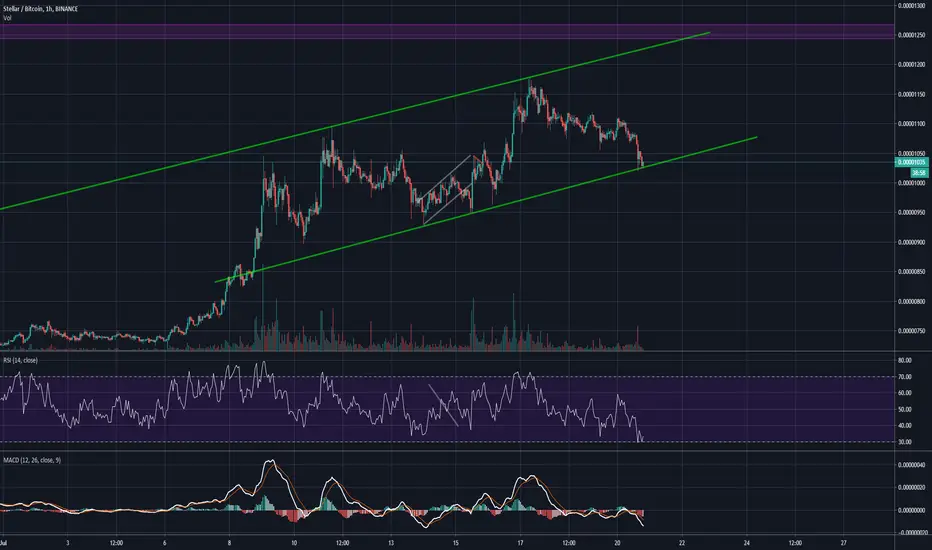
Supreme display of strength at 950 sats.Thanks to our friends over at wallstreet, BTC's buckle down today threw everyone under the rug, the strong rebounded, the weak continue to sit on the floor that they were dropped to. XLM just tested the 940-950 sat range at the bottom of the channel and showed good signs of strength with a quick bounce. 1250-1300 sat target still very viable by the looks of things. Let's see what happens.
