XLMBTC trade ideas

Big Picture on XLM.Hello Traders.
For XLM we have a very important resistance zone above 850 sats to 900 sats area
The price seems to be respecting the short term uptrend line.
But if we break this support I expect the price dropping for the important support level once again and continue this sideways movement.
Please push like button and follow us on Tradingview.
Best regard Sandro and Gustavo.


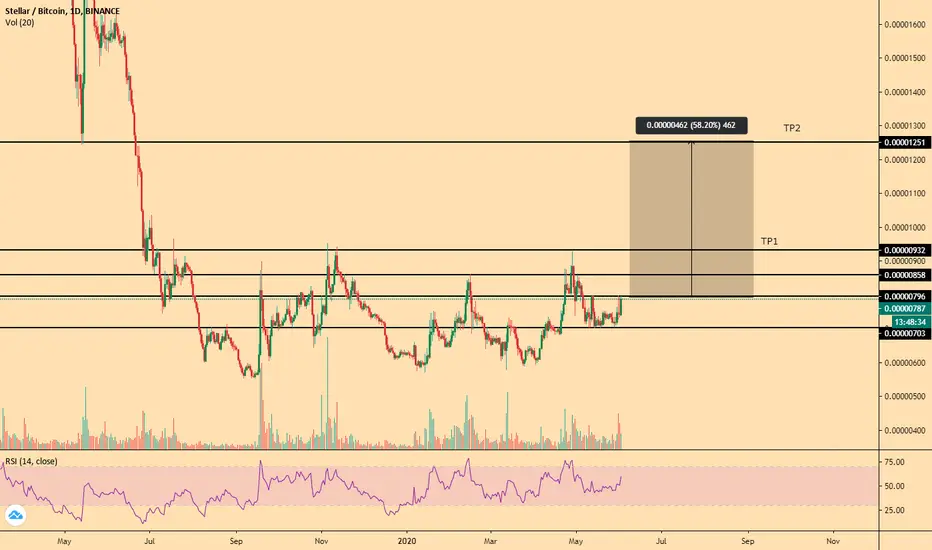
XLM retracementPlease feel free to comment or challenge me on my TA. Or leave a like to show support. Thank you!
-------------------------------------------------------------------------------
Stellar has been ranging in the yellow box since the beginning of July 2019 and is very much due for a breakout/-down. And there are many factors that come into play here.
- MACD indicator show the 12-day EMA is crossing below the 26-day EMA. In 2020 this has led to a period of downward momentum twice. As shown by the yellow arrows on the MACD.
- Each time this happened, Stellar retraced back to either the bottom of the channel (daily support @ 595 sats) or to the middle of the channel (daily support @ 711 sats). As shown by the yellow circles.
- Should this happen again, we'll see a nice retracement towards either 711 sats or 595 sats.
Either way, I'll be setting my buy order just above 711 with a SL of about 2%. If my SL is filled, I'll place a new buy order just above 595 sats, with a SL of about 2%.
Targets will be the daily levels shown on the chart.

XLM-BTC LONG TERM TRADEPlease manage your risk. Use Stop loss. And do not take blind entries.
If you have question let me know. If you want to analyze any pair let me know.
This is just an idea. What we see.
Market can go in the opposite direction, what we analyze. so we have to manage our risk and adopt the situation accordingly.

XLM Still in downslurping channel, breakout soonStill in downslurping channel.
Expecting bounce here or at .618/200ema. Patience🔑

XLM/BTCJun 10
Hello Friends, here my idea to XLM/BTC. Cup & Handle 4H-Chart. (In the chart you will find all information)
-> IMPORTANT: Just my opinion no financial advice.<-

XLM to follow ADA and rise 50% or moreFor a more detailed analysis you can scroll down lower
Here is a summary of why I think XLM should pull a 50% ore more move here:
- 1 year accumulation zone
- Bullish volume in accumulation (strong volume when up inside the range, weak and declining volume when going down)
- Market structure shift on the weekly USDT chart
- 4 higher lows inside the range
- Very similar structure to ZIL and ADA before going up
- Weekl OBV and RSI looking like they are going parabolic
OBV and RSI very strong while price goes sideways
Nearly no resistance on weekly chart
Higher high close on the weekly indicating that a trend shift might occur, also 3 highs with alot of liquidity above them which will most likely trigger strong buying/short stops when above
Clear accumulationg range with volume signaling accumulation aswell
3 higher lows inside the range, happend the exact same with ZIL and ADA aswell


$XLM : Ready for a moon mission ?$XLM is holding Daily 100 MA, 200 MA, EMA 200
Long term range
On low timeframe drawing a falling wedge - Expect to break the upper resistance of the range before a moon mission
Not A Financial Advice

XLM/ BTC possible outbreakWith BTC Dom on a constant downslope this month - ALTS are looking pretty juicy again
If we look at XLM , we notice it's recently been fighting it's very long downtrend. and is currently pushing to flip a key resistance into support
Being on CoinBase already, pumps for XLM have quite a bit of hope
If we can see a breakout past 900-950 SATS , 15-1600 SATS seems very reasonable
DYOR
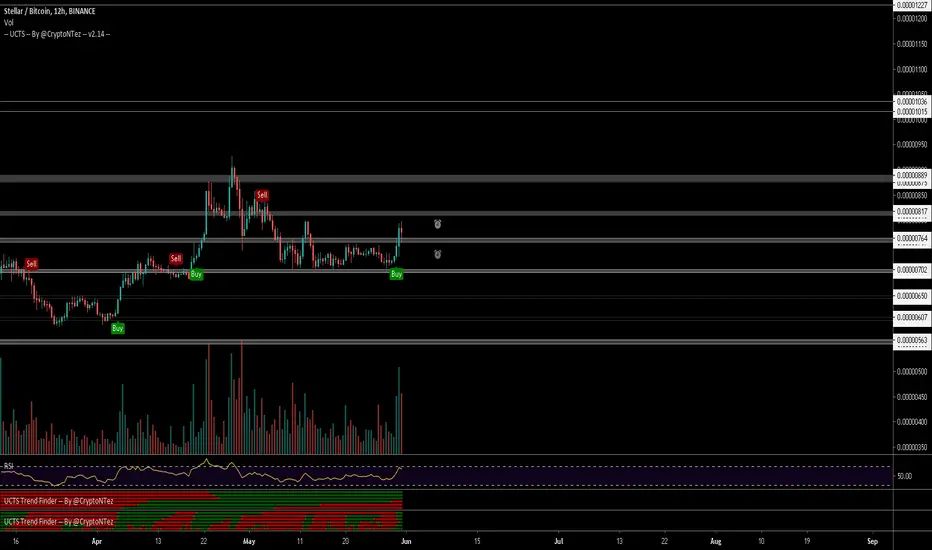
XLMBTC Range Median| Structural Resistance| S/R Flip Evening Traders,
Today’s Analysis – XLMBTC – must hold range median upon a retest to test structural resistance (range high)
Points to consider,
- Range median (local support)
- S/R flip retest must hold
- Structural resistance (Immediate target)
- Volume below average
XLMBTC’s range median is in confluence with local support, a trade location where an S/R flip must hold for a bullish continuation.
The structural resistance is a technical target as it is the range high of this consolidation area.
Volume is clearly declining and remaining below average, this is usually an indication of an influx being imminent.
Overall, in my opinion, XLMBTX needs to develop more to confirm its S/R flip. Establishing a new level as support will allow for a defined risk long trade into structural resistance (range high).
What are your thoughts?
Please leave a like and comment,
And remember,
“Remember our definition of a winning attitude: a positive expectation of your efforts with an acceptance that whatever results you get are a perfect reflection of your level of development and what you need to learn to do better.” ― Mark Douglas

XLM > XRP - Wait for a breakoutAlts are starting to look pretty exciting, however the market has matured and we may not see the same crazy gains we want to see like we did in 2017. It's best to keep an eye on BTC as a clue, as a large price increase might trigger another alt sell off. However, I am leaning more to the bullish scenario for trustworthy alts these days.

XLM/BTC Idea Long #XLMBreakouts + volume = buy trigger
Resistance flip into support
x3 potential
#DYOR

XLM/BTC MULTI-TIMEFRAME ANALYSIS Hello Traders, here is the full analysis for this pair, let me know in the comment section below if you have any questions, the entry will be taken only if all rules of the strategies will be satisfied. I suggest you keep this pair on your watchlist and see if the rules of your strategy are satisfied.

XLM re-enterLooking good to get back into XLM. Could just see a move back to previous VWAP or maybe more.

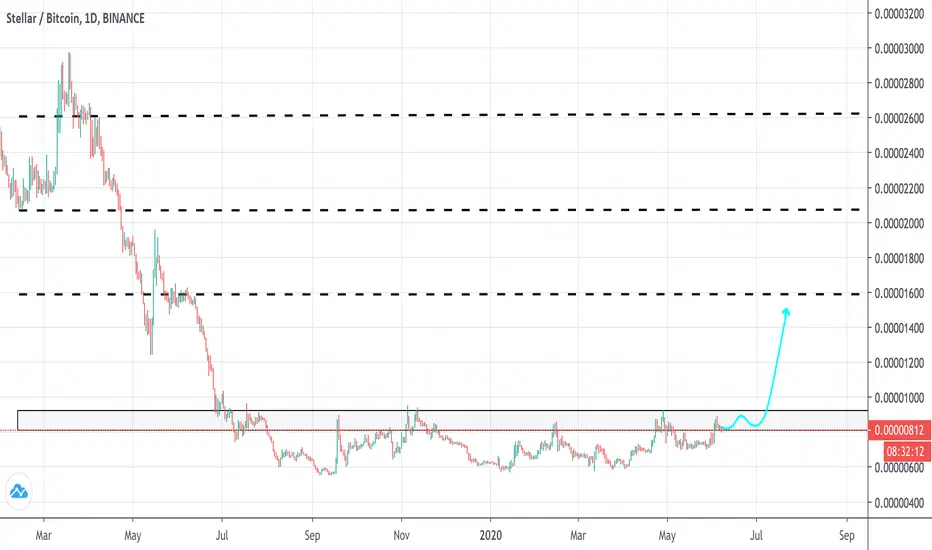
XLM ready for take-offPlease feel free to comment and challenge me on my TA. Hit a like to show support.
------------------------------------------------
- Ranging since 07/2019
- Significant increase in volume
- Range high (886) is very close to being broken
- Chart looks exactly the same as the Cardano chart before it skyrocketed
- Next resistance at daily level (1274)
Waiting for confirmation above range high before I enter.

XLM will move soonIt's time for xlm to move up. You can look for a good entry or buy it when it passed first line. Potential movement is up to 3000 sat.

XLMBTC LONGXLMBTC LONG
Targets on Chart
Stop Lose :- 0.00000725
Target:- 0.00000829
Entry:- 0.00000766
MACD Crossed on daily
RSI going up
Volume increasing
Looks bullish, already formed two candles, expecting one more daily candle.
Comments welcome.
if you like the idea please subscribe otherwise please share your chart.
Thank you.

$XLM, ~760sats level hodling pretty good... $XLM
~760sats level hodling pretty good... a R/S flip here & a break above 790sats (previous HH) can allow some bullish activity toward ~900 sats (15%)
Aim for an entry at support level 👍
#XLM
XLM/BTC Bullish Signal
XLM is showing similar signs of price action to that of ADA (Cardano) before breaking out.
My advice would be to buy here and take profits in the levels mentioned in the chart
Be sure to drop a like to support me, so that i get motivated to make more charts :)