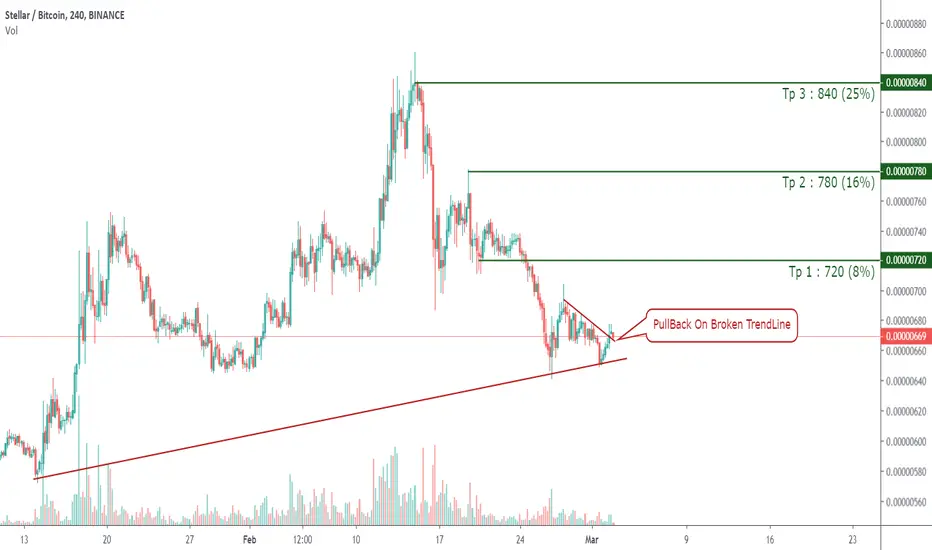
XLM PullBack On Broken TrendLineXLM / BTC
🌐 Exchange : #BINANCE
▶️ Buy : 669
👇 Targets :
✅ Tp 1 : 720 (8%)
✅ Tp 2 : 780 (16%)
✅ Tp 3 : 840 (25%)
🔴 Stop loss zone : 625 ~ 620
XLMBTC trade ideas

XLM price could go down from thereXLM reached a major resistance. Chances are that the price goes down.
XLM could go down 3 %XLM encoutered a powerful resistance. Chances are that the price goes down and gets rejected.


XLMBTC Accumulation phase. BINANCE:XLMBTC has been in this accumulation area for over 6 months now. 1250 and 2100 areas remain untested. I see it testing those areas. I'll be building a position over the next days/weeks depending how it unfolds. A break of the 752 double top would be ideal at this point to really get going.

xlm seems ready to movexlm correlates pretty much with xrp but is less scammy (imo, sorry ripple army)
the chance that it draws a W bottom is high


XLM brokeup MA200 and retested it. Ready to FLY HARDHello everyone,
as I talk and post about BTC.D & Altcoins a lot past days/weeks look at this.
I was talking that BTC.D drop speeding up and every taxidriver and theirgrandmas are buying altcoins. Well most of them are panic selling right now !
Why ?
Well because alts dropped "HARD" mostly 20% in single day as Whales which are 100-400% up took some tiny profits and everyone is in panic
Well in my opinion it was just retest of rising wedge breakdown of that BTC.D chart
and more down for BTC.D to come and great ALTSZN2020 about to start just right here
If you take a look at XLM/BTC Daily chart you can see we broke up the MA200 and we are testing it.
I don´t know about you but I´m just adding more altcoins !
Cheers
-------------
Disclaimer:
I´m not registered or licensed in any jurisdiction whatsoever to provide investing advice or anything of an advisory or consultancy nature, and therefore I´m unqualified to give investment recommendations.
Always do your own research and consult with a licensed investment professional before investing.
This communication is never to be used as the basis of making investment decisions, and it is for entertainment purposes only.


Stellar Aims Higher | Chart Fully Mapped (30% Target)Here is the chart for Stellar (XLMBTC) fully mapped.
On it, you can find the different support and resistance levels based on Fibonacci proportions.
We can also find the main scenarios that I think can come true and they go as follow:
1) Straight up. More growth until the top of the channel in blue is hit.
2) Retrace. If prices move lover and "support" breaks, a retrace can happen before the next jump. We stay bullish.
There is big volume coming in for Stellar (XLMBTC) now and the indicators are looking really good/bullish/strong.
-- More about the volume indicator --
Remember to hit LIKE to show your support.
Thanks a lot for reading.
Namaste.

Don't miss the great buy opportunity in XLMBTCTrading suggestion:
. There is a possibility of temporary retracement to suggested support line (0.0000075). if so, traders can set orders based on Price Action and expect to reach short-term targets.
Technical analysis:
. XLMBTC is in a range bound and the beginning of uptrend is expected.
.The price is above the 21-Day WEMA which acts as a dynamic support.
. The RSI is at 77.
Take Profits:
TP1= @ 0.0000094
TP2= @ 0.0000125
TP3= @ 0.0000207
SL= Break below S2


XLM - Breaking out of Triangle, 15% Target GainsTake a look at XLM. The price has broken out of its triangle and is continuing upward. The 4-hour MACD is also showing a breakout beyond resistance. The triangle target is around .000085, but I'll be watching the price to see how it reacts at this level. I have a hunch it will go to .00009 or more.

XLM/BTC - D1 Update - 12/02/2020In D1 timeframe, appearing Double Bottom pattern, giving bullish signal for long-term uptrend
In H6 timeframe, appearing Cup and Handle pattern, supports the short-term uptrend
Buy zone: below 770
Target 1: 960
Target 2: 1650
Target 3: 2100-2900 (long-term)
Stoploss: below 695
Remember your stoploss
"And finally, the analysis is for reference only, not investment advice"


XLM/BTC 8H (Binance) Ascending triangle pattern in formationStellar Lumens is in uptrend and probably going for higher local high.
Keep an eye on that bullish pattern, the idea is to enter on triangle support, set-up:
Entry range= 0.00000693 - 0.00000707
Take Profit= 0.00000732 | 0.00000762 | 0.00000806
Stop Loss= 0.00000668
Risk/Reward ratio= 1:1 | 1:1.94 | 1:3.31
Expected Profit= 4.57% | 8.86% | 15.14%
Possible Loss= -4.57%
Fib. Retracement= 0.382 | 0.5 | 0.618

Stellar Cup and HandleStellar is concluding a posible Cup and Handle continuation pattern. Target must be placed at least the height of the cup from the top of the cup. Let's see.

Stellar Lumen long term accumulation almost completeXLM has already complete double bottom formation and possible start to gain momentum at spring to take NEW uptrend.
Dozen of indicators print 'buy' on weekly chart
ps check also my other charts
pps please sorry for ling mistakes, I make, I have way to old laptop and keyboard with lot of issues)

XLM Facing last resistance before 800I am highly bullish on XLM here.
There is a cup and handle pattern in addition to double bottom on 4H chart. Once the resistance is broken the next target is 800.
Note: Trade at your own risk. This is a RISKY position.
