STELLER ( XLM ) breakout trade setupprice closed above 50 ema and now having resistace at 100 ema if close above than confirmation that price will move upward
Buy : 700 - 715
Stop : 640
Target : 5% to 50%
XLMBTC trade ideas

Stellar/XLM Double bottom and Head and shoulders 2x to 10x.Double bottom and the head and shoulders indicators are great indicators that give indications of the start of a bullish movement. With a couple months of accumulation , Oversold xlm will look to price correct . The first true resistance test will be at around 850 - 900 . Once broken then XLM is confirmed bullish!!!!

XLM/BTCPrice moves to exit the bull wedge.
RSI 4h - bullish
MACD cross - bullish
Stochastic - bullish

XLM - preparing for 45% pumpStellar has nice move up made of 5 waves and now I am tracking retracement. Ideal support, where I expect some sort of bounce is at 642 satoshi. This bounce should result in next huge move up, but if this bounce won´t be impulsive enough, I will track it only as a "B" wave and then we should see final move down.

StellarGuys, if you like the idea please put like button, this will be the best thanks.
Thank you for your support, I appreciate it.

XLMBTC XLMBTC long,
very divergent then breaks above resistance which becomes support, also just touched the trendline on the rsi. Should move up from here and if you zoom out and look at the bigger picture you can see that there is further potential than what i have presented.


XLM 10% trade setup R:R4Hello.
Today I´m watching out XLM again with another trade possibility. This time long opportunity as its sitting around a support and forming bullish divergence on RSI and MACD with upcoming MACD bull cross on 1h chart.
Trade on your own risk
Cheers
------------------
Risk Disclosure
DISCLAIMER: This is not a financial advice ! Cryptocurrency trading involves substantial risk of loss and is not suitable for every investor. The valuation of asset may fluctuate, and, as a result, clients may lose more than their original investment. Investing will have impact on your trading account and this can work against you, leading to large losses or can work for you, leading to large gains. As an investor, it's crucial to know how much of your money you could lose and what circumstances could cause this to occur. Always do your own research and think twice before you invest.

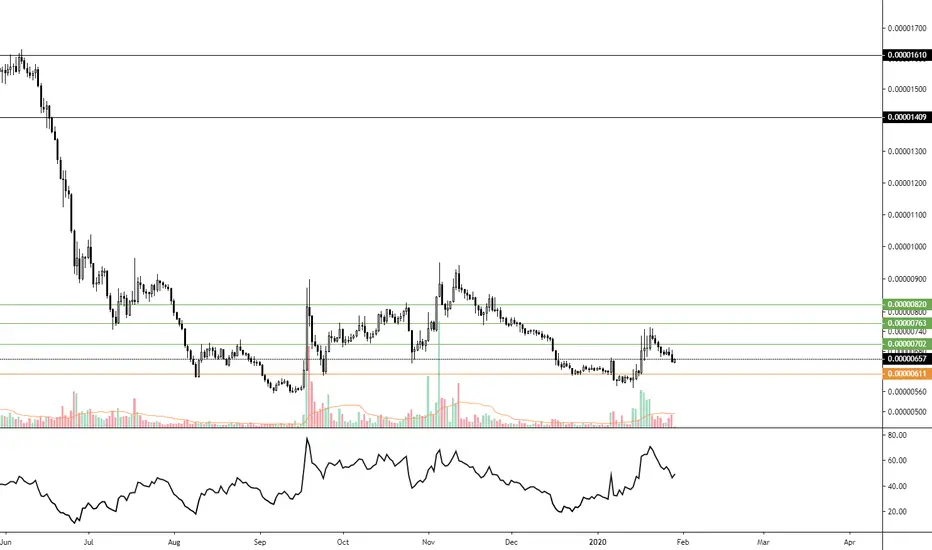
LONG - XLM- Trading OpportunityA retest of previous bullish divergence breakout, looking into watching this develop.
Entry: 0.0000657
Target 1: 0.00000702
Target 2: 0.00000763
Target 3: 0.00000820
SL: 0.00000611
CryptoCue is not providing investment advice and is not taking subscribers’ personal circumstances into consideration when discussing investments. Investment involves a high degree of risk and should be considered only by persons who can afford to sustain a loss of their entire position.
CryptoCue is not registered, licensed or authorized to provide investment advice and is simply providing an opinion, which is given without any liability or reliance whatsoever. The information contained here is not an offer or solicitation or recommendation or advice to buy, hold, or sell any security. CryptoCue makes no representation as to the completeness, accuracy or timeliness of the material provided and all information and opinions provided by CryptoCue are subject to change without notice and provided on a non-reliance basis and without acceptance of any liability or responsibility whatsoever or howsoever arising. You hereby irrevocably and unconditionally waive, release and discharge: (a) any and all accrued rights and/or benefits you may have against CryptoCue in respect of any opinion expressed or information conveyed by CryptoCue at any time; (b) any and all Claims you may have against CryptoCue arising out of any opinion expressed or information conveyed by CryptoCue at any time; (c) CryptoCue from all and any claims (whether actual or contingent and whether as an employee, office holder or in any other capacity whatsoever) including, without limitation, Claims you may have against CryptoCue arising out of any opinion expressed or information conveyed by CryptoCue at any time. ("Claims" shall include any action, proceeding, claim, demand, judgment or judgment sum of whatsoever nature or howsoever arising.) You hereby agree to indemnify and hold harmless CryptoCue in respect of any and all Losses paid, discharged, sustained or incurred by CryptoCue in the event of bringing any Claim against CryptoCue. (“Losses” shall include any and all liabilities, costs, expenses, damages, fines, impositions or losses (including but not limited to any direct, indirect or consequential losses, loss of profit, loss of earnings , loss of reputation and all interest, penalties and legal costs (calculated on a full indemnity basis) and all other reasonable professional costs and expenses and any associated value-added tax) of whatsoever nature and/or judgment sums (including interest thereon).
XLM possible breakout trade R:R2 10-20% profitHello everyone,
Lets make it as simple as possible
XLM can bring a nice trade opportunity for breakout buyers.
Breakout of 750 could lead us to approx. 850-900 where I expect next resistance. (left side of screen/1D chart)
Cheers
------------------
Risk Disclosure
DISCLAIMER: This is not a financial advice ! Cryptocurrency trading involves substantial risk of loss and is not suitable for every investor. The valuation of asset may fluctuate, and, as a result, clients may lose more than their original investment. Investing will have impact on your trading account and this can work against you, leading to large losses or can work for you, leading to large gains. As an investor, it's crucial to know how much of your money you could lose and what circumstances could cause this to occur. Always do your own research and think twice before you invest.


XLM IS THE REAL XRPTitle is click bait. XRP is the chosen one. But xlm looks like it will pump to the top blue weekly level. We are very bullish if we can break that.

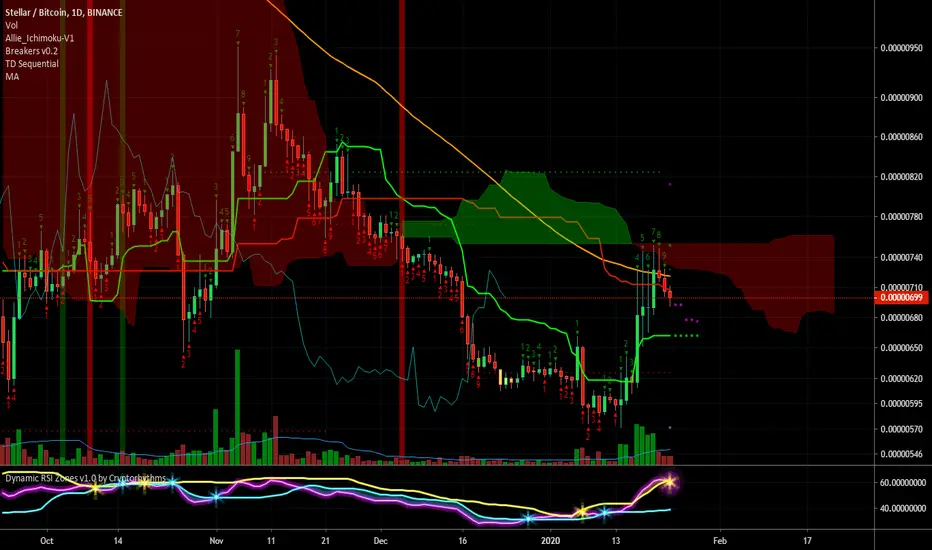
XLM SHORT OPPORTUNITY XLM/BTC looking primed to short with a TD sequential posting a 9 on the daily TF
Been moving but weak and should see some movement to the short side here!
Trade, Chart, Learn, Repeat
Coach K
Ascending triangle 22/01Breakout to the upside possibly -> macd converging bullish again triangle confirmed ( multiple touches ).
50MA moving towards the 100MA tho but can get rejected of crossing bearish like it did in the past. Just watch out if it does cross bearish that would mean being a while below it. ( the 50MA )
Just something that came up in my mind xD


XLM -Signal by EXCAVOInteresting token in my opinion for swing trading due to popularity, large capitalization, good trading volume and other situations, I see accumulation in this zone and I expect a good upward movement with a broken triangle.
RSI 4h - oversold
MA's is crossing in 4h
We are in accumulation zone in D1 chart

BTC XLM STELLARNice volume on XLM/ STELLAR
Hopefully we'ill close this day above the MA200.
If the price prcie keeps climbing the further resistances are about 800/1000 satoshi.

XLM Trade Update - 13% ROE and still runningXLM/BTC - Update
We're coming to hit our second target, 790 is coming!

XLM also looking good !Seems that Stellar has found a double bottom.
Volume is decent.
Positive divergences ...
On balance volume turning up also.

Xlmbtc: pump time!Short and simple.
Xlmbtc should pump while btc drops. Target indicated on chart. Will likely have subwaves along the way.

XLM/BTC, Bullish Gartley, awaiting entry at confluenceBullish Gartley, fib retracement, 200 MA on 1 hr, trend line support
I AM NOT A FINANCIAL ADVISER, DO YOU OWN RESEARCH!

Stellar Lumens Looking Better, High Volume, Easy Target MappedStellar (XLMBTC) is looking better now as a strong bounce is taking place and good volume is starting to show up.
I can see the same signals we are seeing in most of the altcoins that are starting to move... Let's take another quick look at those:
1) Higher low (light blue).
2) Increasing volume.
3) Break above EMA10.
4) Strong RSI with MACD trending up.
5) Most of the people are still clueless about the incredible bullish action that will permeate the entire cryptocurrency markets... especially the small altcoins.
We have more signals and tools that we can use for charting and trading, but the ones above are more than enough for us to say that Stellar Lumens completed its retrace, now it is time to resume its uptrend.
Namaste.

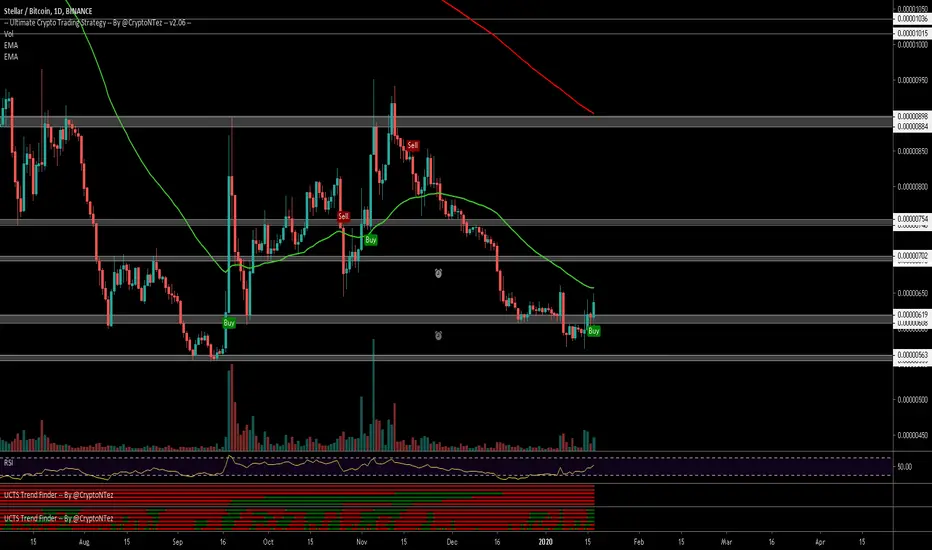
$XLM, Flipping into support ~620sats level and pushing up..$XLM
Flipping into support ~620sats level and pushing up with some volume...
UCTS Buy signal flashing on the 1D
RSI bullish divergence..
If it gets traction from here (Volume mostly) then next target should be at ~700 sats (12%+).
#XLM