XLM breakout - Good entry from hereXLM/BTC
Exchange: Binance
Buy arround: 0.00000642 - 0.00000655
Targets:
Target1 : 0.00000710
Target 2 : 0.00000780
Target 3 : 0.00000839
Stoploss: 0.00000590
XLMBTC trade ideas

XLMBTC Brokeout Resistance bull Is comming>??XLMBTC now looking Good.
Very long resistance line breakout upward side and now we can see some uptrend.
now current price is 640 Satoshi.
if price hold above this trend line then we can expect 30%-70% profit.
entry: 620-640 Satoshi.
Targets: 870/988/1233 Satoshi.
Check chart and learn and earn with your good Strategy .
Like share and follow.

XLM/BTC, Bullish Butterfly (Monthly chart)Seems like there maybe a bit further bleeding even though I'm hoping XLM has one of those DASH pumps that we just had which I got a good amount out of. XLM/BTC looks bullish to me longterm once zoomed out and looking at the monthly having nearly completed this harmonic and the stoch rsi just waiting to cross bullish.
@moon333 here on TV posted a monthly chart as well but that doesn't look too accurate to me, although he has more experience and could be right. However this is the way I am seeing it. I did buy some at current levels for the longterm (unless we get a DASH like pump and then I will sell to book profit and rebuy lower).

STELLER Daily breakout and Resistance | Trade IdeaBuy : 600 - 625
Stop : 7%
Target : 5% to 20%
1 ) Daily breakout
Daily RSI
2) price taking support at 12 ema .
3) 4 hour chart 21ema - 50 ema cross and 100 ema resistance closing above needed
overall loooks good for long


XLM/BTC | Key Channel AnalysisWaking up to a smile is nice, the market looks nice and may have everyone yelling HODLLLL. I don't get excited when I see all this "hype" produced by these noobs, analysis and trade. If a coin is going to moon then wait for it to break channel resistance if it's such a sure thing, that goes with any stock/etc...
This analysis is just to show you key levels of support and resistance. If we can hold this channel, you see your buy and sell zones :)
DotcomJack
As always, I am not a financial adviser nor am I providing financial advice.


Altcoin mirroringFirst of all it is difficult to do fractal predictions without trading view PRO, so heres a comparison. Stellar, ZRX and XVG can be seen to be mirroring BTC in there movement patterns. This is the pattern I have been talking about for anyone following my posts!

XLMBTC Daily Chartlets see what happens, crypto is very crazy and right now bitcoin just looks weird IMHO


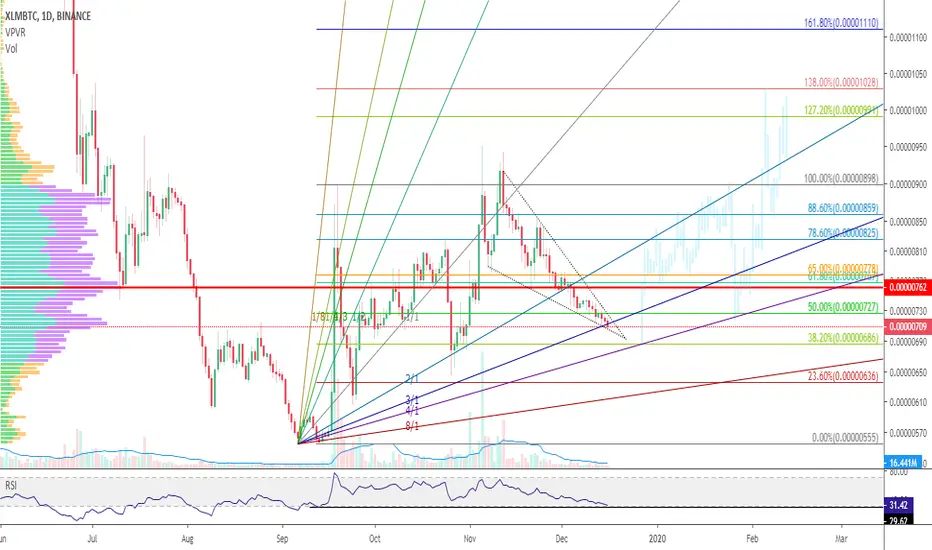
XLMXBT 1 day chart: is it in a 5 (impulse) wave up?Possible scenario (to be confirmed):
- Wave 1 seems to be a very ugly leading diagonal
- Wave 2 is a good looking zig zag retracement
- Upcoming waves 3, 4 and 5 are plotted based on normal impulse wave rules, however there is not sufficient data to confirm.
The pitchfork is used to have a sense of the slope, though insufficient data to confirm.


XLM/BTC Long setup R:R3 45% G / 15% LBigger trade opportunity possible.
Trade only at your own risk.

$XLM/BTC Falling Wedge pattern - bullish break out expectedOn the short-term XLM/BTC chart there is a Falling Wedge pattern.
But price can go in both directions considering current market sentiment.
Thorough XLM/USD and XLM/BTC analysis here .
Do not forget to use stop-loss.
Trade carefully and good luck!

Stellar Lumens - 4H Trade IdeaDue to popular demand, this is a zoomed in version of my last Stellar post about the imminent breakout of altcoins and the topping of bitcoin dominance.
The move up to 898 sats was held by a historically known resistance level. From there since it didn't break out, the move failed and found the lowest support it could at 685 sats.
Entry at the Support @ 685 sats
(Anything below 755 sats is a GREAT buy)
Short-Term Target SELL @ 898 sats for a 32% gain
Long-Term Target SELL @ 1250 sats for a 64% gain
History repeats itself on all of these altcoin charts, let alone bitcoin. It really is the start of altcoin season and I could make a chart on every single altcoin, they ALL look the same..
As always please do your own research, I am not a financial advisor.


XLM 4hr Possible Break out in a day or so...
Very little volume here so not sure if it will break or just hang on the resistance line.
Thoughts!? Looking for any feedback or discussion...


XLM / BTC 4 HOURMS STELLAR, WHY YOU LET US WAITONG SO LONG MEN?
It's looks we getting some serieus fireworks or big nasty red dinosaur bite!
* Is forming a big falling wedge from the beginning of November
* Volume almost 0 zereo
* The slope of the moving averrages on the MACD showthe bearish momentum looks it's decision time
* We need to break the trendline on the RSi who's who's pushing the price down.

XLM / BTC 4 HOURMR XLM? IT'S TIME MATE!
* Big falling wedge!
* Almost 0 volume!
* Tested the 0.786 vib level
* Big Triangle on the RSI
* Need to break the Stoch resistance line!
Come on, Let's go!
