XLMBTC trade ideas


Stellar has been quiet...but it just broke out.XLMBTC has traded in a descending triangle, which it just breached in an upward direction.


11.12.2019 - Stellar (XLM / BTC)Hi Traders!
Today we are betting on altcoin against Bitcoin again. In recent weeks, this is the most interesting segment of the entire market. In particular, we will look at the XLM / BTC.
Why this coin?
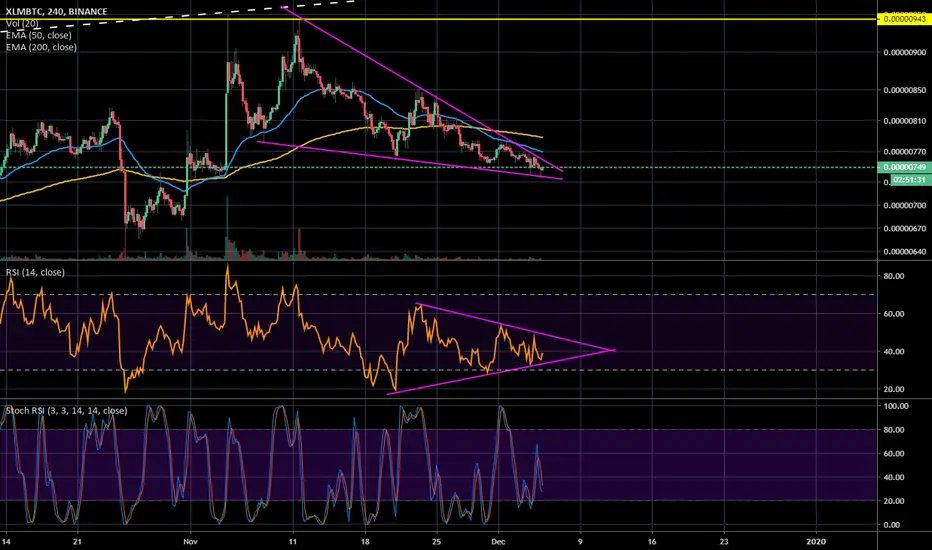
In the upcoming days, there could be an upward break . The graph nicely shows 5 upwards waves and then ABC correction. Moreover, the last structure resembles a falling wedge and, in addition, we are on long-term support. The only missing thing here is an impulse. We are in a zone of a highly probable hard break , that won't be missing volumes either.
The whole market is currently very difficult to predict. Bitcoin has been going sideways for two weeks. Both big and small altcoins write their own stories as well. At the moment it's very difficult to find such a nice construction that would have a chance to grow. Despite the graph looking very good, we need to break out the falling wedge.
May the crypto be with you!

BTC/XLM STELLAR H4 TFFailling Wedge on XLM/STELLAR 4h time rime/ break out possible
Bullish divergence na RSI


XLM - Lumen's Massive Inverse Head and Shoulder (80%+ gains)Hey team! Not to bombard you with XLM posts, but after looking at the chart again, I noticed an inverse head and shoulders setup that I wanted to bring to your attention as well. With nearly a 400sat head height, our target is just shy of .00001350. Just in time for the holiday!

XLM In Buy Zone, loading for launch!XLMBTC
Staged for takeoff,
Bullish Harmonic XABCD Formation found with the @coinbsalgos Scanner
And currently in Phantom Script Buy Zone
Accumulation: 748 to 743
Target 1: 804
Target 2: 849
Likely larger targets due to market sentiment being in Altseazon.
Links to Indicators are attached.

#XLMBTC (Mid Term) 11/19 #XLMBTC (Mid Term)
Buy : 0.00000747 - 0.00000711 - 0.00000677
Target 1: 0.00000784
Target 2: 0.00000859
Target 3: 0.00001008
Target 4: 0.00001270
Target 5: 0.00002000
Stoploss: 0.00000662
Invest: 3%
Risk/Reward: 7% /
we ask Allah reconcile and repay


I call the bottom + Legendary movement to the upside ! Hello,
careful what you wish #XLM this area is the bottom !
Moon it
good luck.

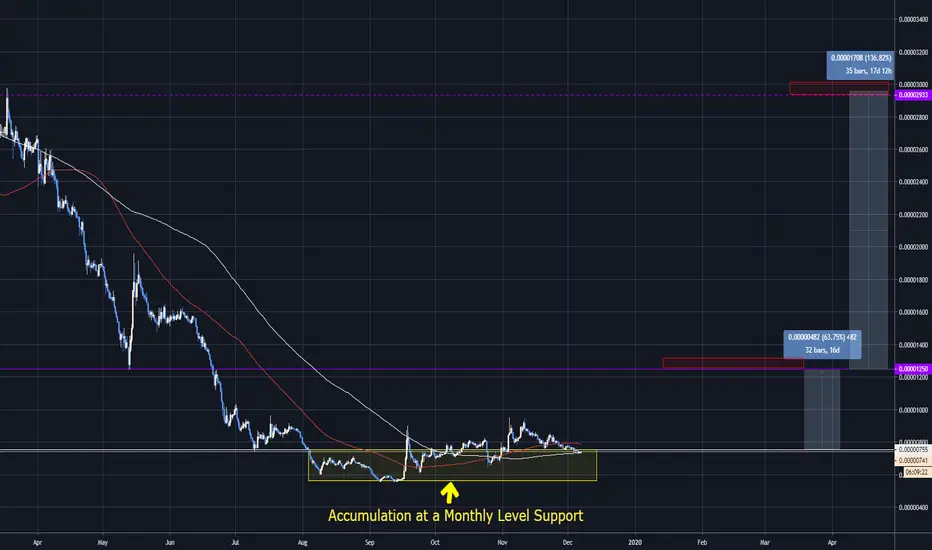
Stellar Lumens Potential 200% Play - Daily AnalysisJust like every other altcoin, stellar lumens looks very bullish. It's finally stopped bleeding, and found support at a known monthly level @ 755 sats.
For the last 5 months, price has been in accumulation around that level and is starting to breakout. We can confirm this movement by the 'golden cross' of moving averages, meaning the 200MA (white) crosses the 100MA (red).
Entry at the Monthly Level Support @ 755 sats
(Anything below 755 sats is a GREAT buy)
1st Target SELL @ 1250 sats for a 64% gain
2nd Target SELL @ 1708 sats for a 136% gain
This move may take a few months to play out, but it will. History repeats itself on all of these altcoin charts, let alone bitcoin. It really is the start of altcoin season and I could make a chart on every single altcoin, they ALL look the same..
Anyways, If you want to stay updated on this stellar 200% play as well as other altcoins, feel free to join my telegram groupchat. There's a little over 200 of us in there right now talking all-day about altcoins. If you're already in the Telegram, shout out to you guys you're the best!
XLM BTC BUY (STELLAR LUMENS - BITCOIN)Hi there. Price is forming a continuation pattern to the upside. Wait for the price to complete the pattern and watch strong price action for buy.

12345 Pattern + Bullish DivBullish divergence has formed, possible target for XLM reaching 1000 Sats retrace on the falling wedge and then go up further or -> touch the resistance line of the wedge and go down.
This is my opinion, not financial advise.

xlmi am not bullish or bearish but if btc runs to 16541 xlm goes 31 cents and retraces vs btc to make a head and shoulder again while btc goin 20 k xlm wont move which is what it did in 2016 went to 3.1 and btc went to 1156 xlm didnt move. and it goes 20 percent down vs btc while btc goin 20 k and retrace 10 12 percent that would take it to 25 cents xlm while btc hits 20 k but here is the killer btc will go down to 13800 and i dont believe xlm will complete that god damn head and shoulder until btc retracement is over which is 30 percent more cut from 25 cents we will go 17.50 cents. Of course if btc moves, I think they made everyone paranoid as fuk so 16k might be closer than 5800

XLMBTC Cup CrackingXLMBTC still hanging in there . Needs to make it past the 0.00000749 resistance line to get back in the cup. If it can do that it will right back on track for at least 0.00000766.

XLM - Nearly Completed Wedge Hitting Support - Ready to BreakoutI like XLM's setup here. The price action is in a large falling wedge that is nearly completed as it hits support. This looks like a prime opportunity for the price to break to the upside. I'm long here.

XLM / BTC 4 hourMR Stellar Is:
* In the apex of the traingle
* In the RSI Triangle
* Arround the golden pocket of the Fib retrace tool
* This will be nasty or big green green rihno bar time!

XLMBTC CUP Closer lookXLMBTC is ready for a big move. It's at the end of a symmetrical triangle. Good Trading!

XLMBTC CUP still holdingXLMBTC Cup is still holding. If it holds we can count on some upward movement in the next couple days. Good Trading!
