$XLM, Looking good, crossing over resistance/ EMA50 at ~860sats $XLM / $BTC
Looking good, crossing over resistance/ EMA50 at ~860sats
UCTS Buy signal at the 8H chart
RSI & MACD looking bullish
Aiming for 1k sats as first target...
#XLM
XLMBTC trade ideas

$XLM Crossing over 860sats (resistance) $XLM / $BTC,
Crossing over 860sats (resistance) as I tweet with volume
UCTS Buy signal on the 6H and 12H charts.
RSI over 50 & MACD rising
If flips into support, Aiming 950/1k sats as targets
#XLM


Stellar – 310% Profit Possible. Bullishness in the air.Hi Guys!
Today we recognized another interesting opportunity.
XLM price touched one of the lowest levels ever at 0.00000726.
This is the minimum from December 2017.
From that point, the price started mooning.
Of course, the market was different at that time but the current price is super low and very attractive.
Given that the alt season will eventually start, we can count on very high profits soon.
Here are the technical analysis details:
• The price is heavily oversold - it is time for shopping.
• RSI – positive divergence - bullish
• Weis Waves – there is a clear decline of the supply which is also bullish
• Ichimoku Cloud – the price is about to cross Tenkansen which means bullishness in the crypto world. Wait till the daily candles close is above Tenkansen.
• Don’t forget to set you stop-loss – 10/15% below the level you buy.
That’s it.
Thank you for reading and your time.
Let us know whether you think this is a real bottom. We do.
Please comment down below.
Have a wonderful weekend.
MASSIVE Hugs!
WBM Team.

C & H XLMBTC ; Short to mid to long Another parabolic upswing for the optimum entry making it poised for an ideal shortsell position
Essentially this is also a viable Long position and TP target for short and Long are both presentable As entry points indicated by the lines drawn on earth he chart you see above.
Short @ 838s
Trade safely and invest wisely. Peace & love.
@a1mtarabichiShort to mid to low

XLM Long 5R/RTrying to snipe a reversal on some of the alts. XLM is my first candidate. Bid is filled, further comments to come.

#XLMBTC 7/19XLMBTC
Moving in falling wedge above weekly support and all of us knows what will happen after breakout this wedge
first big pump, or sideways movement
we will trade current support but this risk due to we expect more drop for XLM
for now, you can buy it between 840/785
Targets
860
900
1028
1350
Hold
Stop_loss:758
Invest:3%
Risk 7%
If XLM fail to rebound and breakdown we looking for 600/400/280 as support levels and demand zone
we ask Allah reconcile and repay

XLMBTC time is running outKeeping an eye on XLMBTC falling wedge. XLM is one of the only major Alts not to have a run this Bull season. Falling wedge started November last year and coming to and end. Break out or break down??? Time will tell.

XLMXLM HAS A HAMMER ENDING WEEK IN 3 HOURS AND IT SHOULD MAKE A RUN AGAINST BITCOIN NOW ANOTHER FREAKING BUBBLE SO TIME TO BUY

#XLMBTC - Add to Wathc list & set Alerts#XLMBTC
This is not a shitcoin shitcoin. I will be watching for a break. You too, set some Alerts. Remind me if and when we get out of this shitty down trend. Has a big potential. But i wont bother until we breakout and i see confirmed reversal signs.


XLMBTC shorts and long exit points
TP Target short 1 & 2
(LONG) 940s
stop at 814s
Excellent timing for this consolidation as this, EOS and Xrp are the 3 alts that seem to be trailing behind the bull run and didn’t get a proper altseason yet.
It’s looking like that might happen today for XLM and XRP soon. I didn’t get a chance to check EOS yet but I wouldn’t be surprised.
Many people forget that XLM Is a multifaceted digital conversion and payment facilitator so it is only organic & normal for its priceaction to be in tandem with that of other coins like BTC/BCH/LTC and IMO the reason it got overlooked and most people don’t see that the bullrun is coming until it’s too late so here’s your chance choose not to FOMO!
Further evidence is bolstered by the volume index and wedge on the XLM BTC pairing as well as XLMETH
Disclaimer
This is not a financial advice it is purely for entertainment and educational purposes. Also looking like PTCUSD is due for major surge which Was expected anyway yeah with the news of social media summit and potus tweeting about Crypto for the first time, It might facilitate an expedite that run. invest carefully and have a great weekend!
@a1mtarabichi

Is XLMBTC about to take off?Okay, bottom fishing is not the easiest task when you're about to choose an investment strategy. So what?
Strong signals should always be taken into account: trading, after all, is mainly about computing expected values; hence, you're expected to pick the likeliest event up, no?
So what we want to do here is pretty simple: altcoins are experiencing a long lasting downtrend, both with respect to BTC and to fiat money. But XLMBTC is something you cannot compare to its peers like EOS,ETH,BCH and so on. XLMUSD has fully retraced, but finally it has found strong support in the 0.08$-0.09$ area. Now, we do not want you to buy it immediately; rather, we prefer to sketch two strategies which are consistent with your risk profile.
The first one is very cautious: you can buy once XLMBTC breaks the upper resistance of the falling wedge. We are looking for a potential reversal, so, as always, do not forget to check first RSI and Volume indicators: the key point of this approach is to recognize that XLMBTC is currently undervalued; yet, strong weakness should never be bought.
The second strategy is much more aggressive, as you could buy once the Tenkan Sen is broken and then, accordingly with your target, you can trade in the falling wedge. We see that today this currency pair is already pushing hard, but still has found strong resistance in this area. Not sure it can climb to the upper resistance too easily, hence wait for confirmation, personally I don't feel comfortable buying at these levels yet.
XLM - BOOM?Nice and perfect IF it can pass the 800 resistance.
Buy after a confirmed break above 800 and chill!
Targets
1250
1500
1900
Stop loss (For God sake use it) 800
Time analysis: 14 Jul and 11 Aug


#XLMBTCResistance and support have been identified and now support seems to have been broken;
Time limit is specified;
The price is within the channel;

#XLM : Upto 75% Profits In The Mid Term.#Accumulatio_Recommendation
Pair : #XLM / #BTC
RSI : 39.65
TA Notes :
- MACD : Still in bearish mode in the longer time frames but looking bullish for the 1H chart which will be a bullish indication.
- RSI : Is in a good position showing a bullish behavior too at a neutral position for a leg upward move for the 1H chart.
- EMA : Looking to go below the candle stick formed and seems to be going to be below the price in the short run for a bull indication in the short term.
- Volume : Showing a very good volume spike by the past 2 hours which will be a good energy for the short term and for a reversal bull trend formation.
- Candle Stick formation also looks very bullish and if the current candle could manage to close above the resistance line in RED it will be a confirmed reversal bull trend for the short term.
#Accumulation_Zone : 750 sats - 765 sats
Distribution_Zone:
Target 1 : 792 sats
Target 2 : 820 sats
Target 3 : 843 sats
Target 4 : 865 sats
Target 5 : 898 sats+
STOPLOSS : Close below 745 sats
Risk : High
Capital Accumulation : 4%
@TogetherWeAccumulate

XLM/BTC - Going to Mars!Hi, today we are going to talk about XLM!
We have the price looking at the all-time low of December 4th, 2017. Historic supports generally have a preponderance in the market, as older, stronger they are.
Thanks for reading, and have good trades

You have 2 Places to buy $XLM against $BTC #BITCOINYou have 2 Places to buy $XLM against $BTC #BITCOIN
I love to enter at Number 1 cos it gonna confirm the triangle"s break
its way better than number 2 , but it still a great area due to Gann methods
the Target is the same for both ,The Stop loss is 15% below the rectangle number two
Good luck ,mates ....
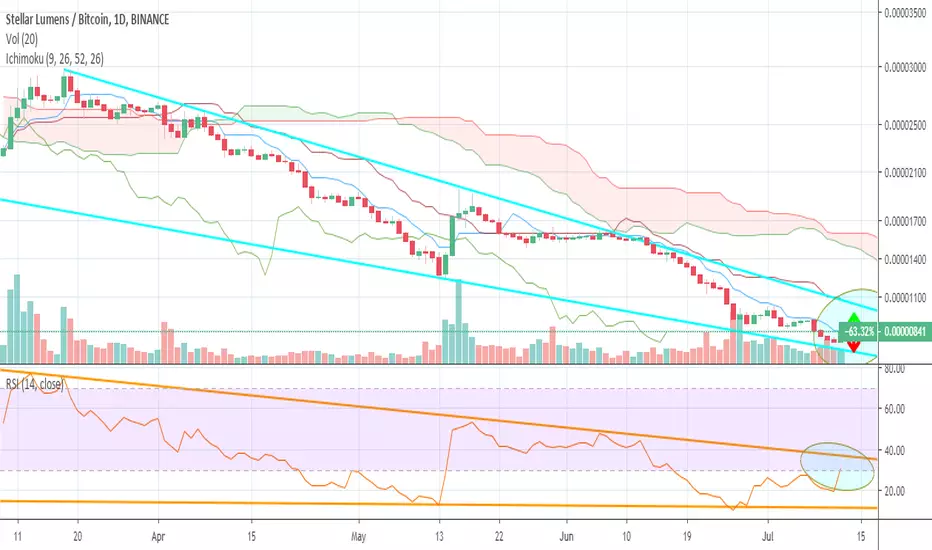
XLM CAN'T GO LOWER BRO, LOOK AT THE RSI Obviously it can, and XLM provides an excellent case study in how indicators especially the RSI and Stoch can remain "over sold" for as long as the market desires.
With that said, it does look like it's consolidating at 850, yes EIGHT HUNDRED AND FIFTY SATS. I had to do a double take when I saw it, insane that this traded at 4000+ sats not too long ago.
