$XLM
$XLM
The 4h chart is showing a falling wedge pattern and is also at the apex. But it would be better to wait till 1250 because previous lows always act as good support.
XLMBTC trade ideas


XLM: a breakout up soon?!XLM is slooooow lately. Not a lot of volume and we are just ranging around the 1550 area for days now.
Lets take a look at the timeframe: stoch RSI is OVERBOUGHT everywhere ... except in 1D ! So, we may be ranging for a while still but the moment we are taking down the 0.20 Stoch RSI we might see more action.
Also, be careful of BTC movements which are really inconsistant these last weeks. A BIG move down for BTC might hurt XLM but except that I think it's time for A BREAKOUT UP. Of course, some more interesting news from Stellar foundations about its concrete use could help. Like, you know: which banks would like to partner with them and use XLM!
Buy today or wait for a little more action up or down.
Sell target: 2900 to 3200 sats.
Attach your belts ladies & gentlemen.


Stella AccumulationThis is in my opinion a Wyckoff Accumulation Chart with low volume spring playing out at the moment?
Of course there is a bit of time yet before this confirms!

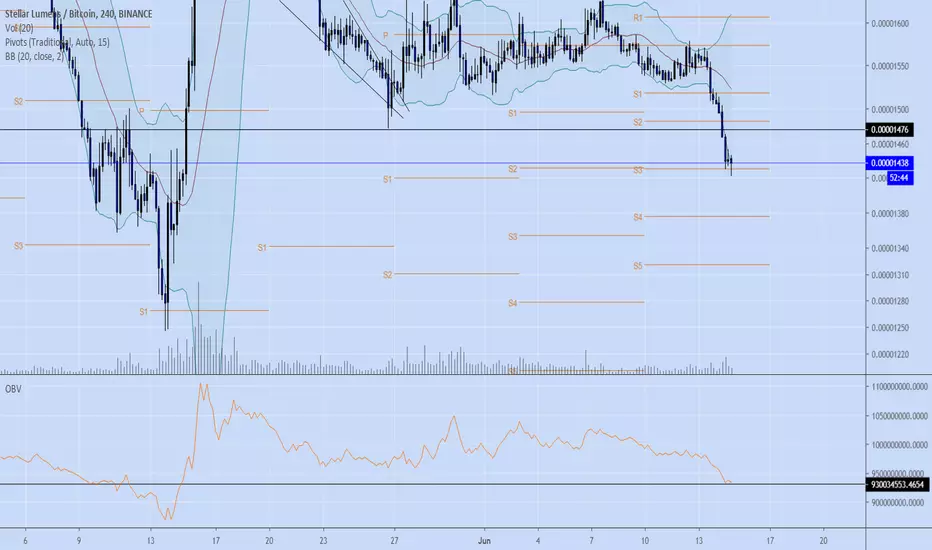
#XLM $XLM #STELLAR Looking for a bottom - possible SFP!Waiting for this 4H to confirm a bullish SFP
Double retest of the current 4H pivot
Full confirmation would be breaking above my overhead line of 1476 with high bullish volume off of a bounce from here
Might just keep dumping from here, but im watching it closely
Where ma chads at?

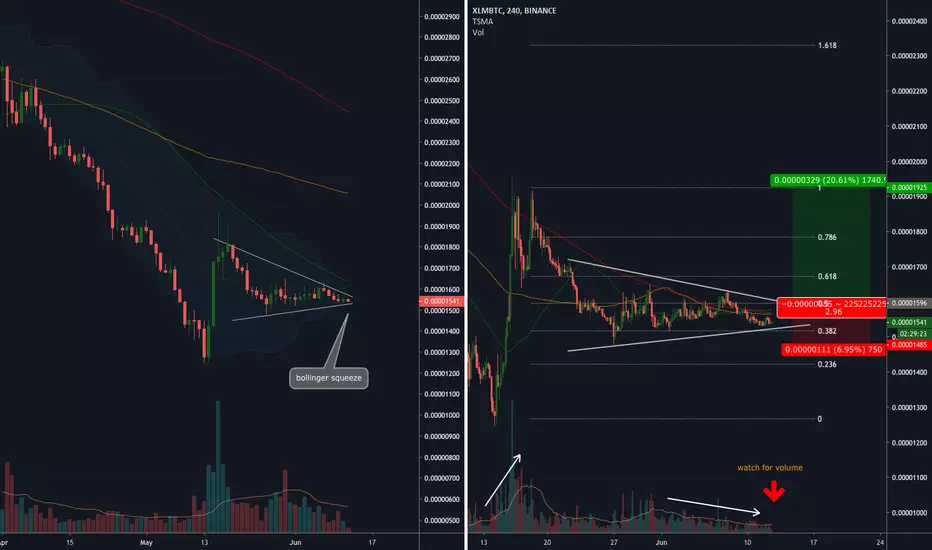
XML/BTC Mother of SqueezeWelcome to this TA on XLM.
We can observe from the daily charts that we are experience a hell of a squeeze on the bollinger bands as the price coils in within a wedge at around 1500sats. We can only await a breakout or breakdown at this point.
However, is it going UP or DOWN?? That's the big question.
The 4hr charts give us a bit more insight into this. It remains clear that price is downtrending (trailing below all three MAs at different timescales). However, as the price consistently retests the longer term MA (200MA in red), we can observe price action making higher lows, indicating stronger support. It remains to be seen if price can break above this overhead resistance.
This is how i would play it:
1 - Watch for volume
2 - Watch for price if it breaks above the three Moving Averages
3 - If volume does follow through, we may likely see a huge upward movement
4 - Plan exits at Fib levels, mid term would be the previous high (just below 1900 sats), about the same level as the anticipated 100MA (in orange)
Happy trading lads!
XLMBTC , it's Enough let me go to moon0.618 perfectly taken support there and now ready for 1800 to 2000 as our first target
it's ready you can buy with sl 7%


longLooking to reach the target area. we are moving sideways but we broke the downtrend so an up-move is probable.


XLM Accumulate before explosionBTC Down but XLM still strong now. what it means ?
XLM is in Accumulation Zone (Green Rectangle) between 1500-1600ish.
Bears still trying to make it down to buy cheaper, but it looks like XLM not want to go more down.
Airdrop is over. Now just consolidating for the next push up.
the next break up to 1900ish will be a strong reversal sign because we will breakout a long Downtrend.
if it goes down it can back to 1500ish but we are already very down, so if you are not a scalper nothing to scare.
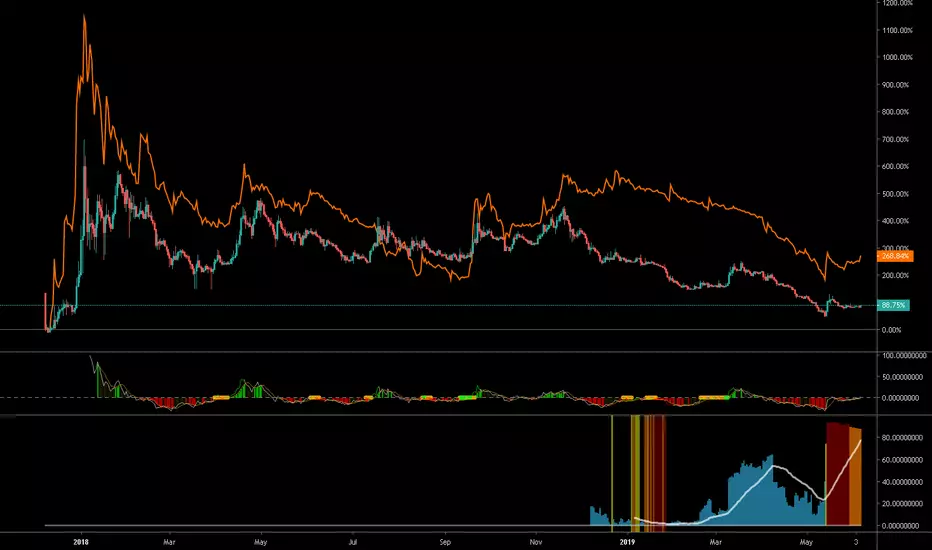
And don't forget that Stellar had a very different trend than BTC in 2018-2019.
i will add some graphs to explain more clearly.
Happy Tr4Ding !

