XLM 4/15/2023 @ 9.51 pmXLM will fall to 0.10 & I will buy in! XLM will rise & I will set some sell stop limits!
:)
XLMBULLUSD trade ideas
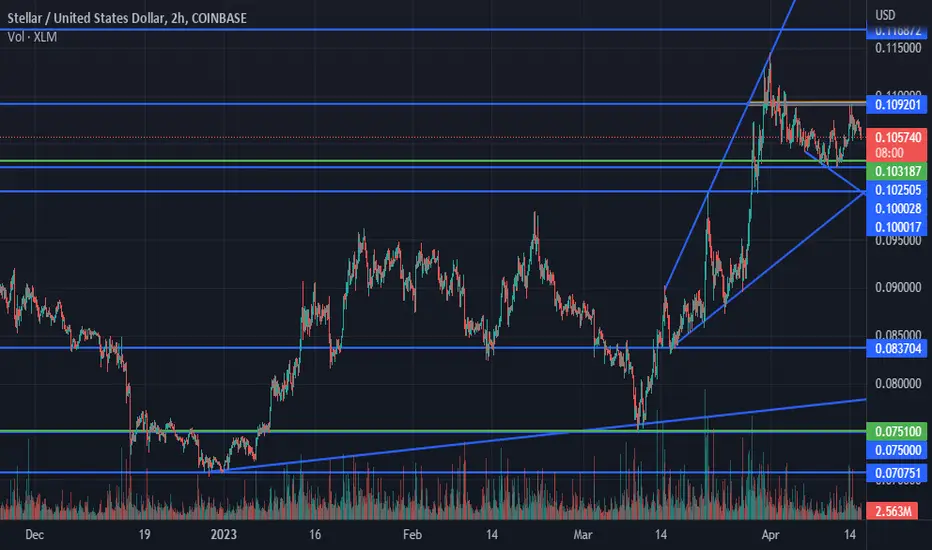

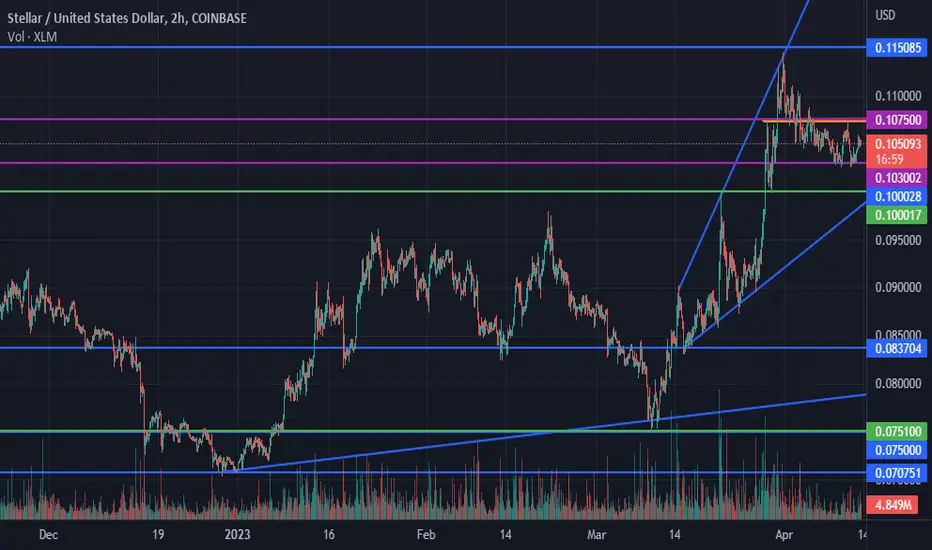
XLM 4/13/2023 @ 2.02pmMy support + resistance levels!
If XLM breaks resistance 0.1075 BULL mode! around 0.1150
If XLM breaks support 0.1030 BEAR mode! around 0.1000
Trying to get in XLM @ $0.1000
Where do you see XLM going?
Comment like share
THANKS


Stellar- A very nice bullish structure (30% rise potential)Like all the crypto market, XLM also reversed at the beginning of the year.
Recently, XLMUSD managed to also break above 0.1 and, after the recent high, is in a normal correction.
This correction could represent a good opportunity for bulls, with a buy around 0.1 support having a 30% rising potential
A break under 0.1 negates this bullish scenario

XLM IDEA, POSSIBLE 25% GAINSXLM has broken back above old support. History shows us that every time it has reached the above resistance. If it was to retrace and show that it held support, then I would take the long to the above resistance. I will update if the opportunity arises so make sure to follow!

XLM TO $.1699 on April Fools DayXLM to $.1699
What Symmetry!
April Fools!
WE AWAIT THE LIGHT
1X10^(-27) LM

AW Stellar Lumens Analysis - Approximate Correction End Date...In this video I go into the many different details that point to when I expect XLM to bottom out.
Using a confluence of different data points, I forecast an approximate month and year.
During this time, I also expect to see some extreme turbulence in all markets due to the end of some larger cycles.
This will lead to some extremely rare opportunities to create generational wealth for those that dare.
Remember to use Disciplined Money Management Principles to ensure longevity as a trader.
If you don't know the long term pattern shouldn't you be doing your research instead of just following the crowd?
Just remember: I am not a financial adviser; I suggest using this only as a guide. Always do your own research.
***AriasWave is not the same as Elliott Wave so your counts may differ to mine if you happen to use it.***

XLMUSD (4H) - Bullish wave LTFHi Traders
XLMUSD (4H Timeframe)
A high probability, entry signal to go LONG will be given with the upward break of 0.1110 after the market found support at 0.1049. Only the downward break of 0.1049 would cancel the bullish scenario.
Trade details
Entry: 0.1110
Stop loss: 0.1049
Take profit 1: 0.1205
Take profit 2: 0.1300
Score: 8
Strategy: Bullish wave LTF

Stellar's highsI had put all analysis last year before yellow lines there, and the pattern is still predicted until nowadays jaja
It is pretty interesting we have a nice chance with this coin, let's wait.

XLMUSD finally validating the inv h&sStellar’s XLM looks like its finally gonna trigger the inv h&s pattern it had previously done a fakeout or 2 above the neckline of. We can see before on its first trip above the neckline the original right shoulder was extremely small…it then went back under the neckline and has since created a much more robust right shoulder before now finally breaking back above the neckline with the type of authority that gives me confidence that it will reach the measured move target this time. In doing so it should also take price action above this descending trendline its currently testing the resistance of which if it can do so and then flip that trendline to solid support should also trigger a breakout from a triangle pattern its been in for quite sometime that can then eventually lead to much higher breakout targets than just this inverse head and shoulder target allows for. *not financial advice*

XRP's Valid Topping Suggests Bearishness for XLMXLM is a fork of XRP and trades similarly. As you can see XRP has been more volatile recently. However, XRP ran into resistance 2 days ago with a topping tail. XLM has not but has pulled back from today's highs. I shorted it.

XLMUSD - CNH AND BULLISH FLAG 1H TFCup and handle , Bullish flag both continuation pattern can seen on 1H TF

XLM|USD on Daily BreakoutI've been watching this one for days waiting for a breakout and boy did it breakout. My take profit area is at $0.11. What a great set up, the view from the RSI, MACD and price action is just beautiful! I'm placing an order to buy more at $0.89 encase we wick back real quick and a stop at $0.85.
Happy Trading!

XLM .088Let's see if we get a third bounce off the trend line...
That trend line is easily in play from now until the end of the year.
We also have good confluence with the .786 fib extension from the ATH in January 2018, to the low in March 2020, and to the high in May 2021.
A touch of .086641 at the .786 fib extension has a good probability.

XLM Lights Out on April Fools 2023Don't be fooled...
XLM to .017
XLM Lights Out on April Fools 2023?

Stellar Lumens Flipping Trends Weekly MACD and RSI beginning to turn bullish suggesting a great opportunity for bulls to take a long trade
First target .35-.40

🔥 XLM Bear-Market Ended: Preparing For The Next Bull-RunOver the course of ~6 years, XLM has been trading inside the pattern drawn on the chart. With the price reversing from the bottom support early January, we can make a good case for the idea that the bottom is in.
At the moment, we're likely going to see a long period of accumulation, maybe a year or more. The top resistance will function as the main target for the next bull-run, which could net in some decent long-term gains.
For better readability I've copied the previous bull-run in yellow. This is not my prediction, but merely an indication.

xlm Chart where i go over my views on xlm, chart looks good to me on the higher timeframes and lower timeframes look to be breaking out soonish.

XLM trying to breakout.XRP has been pushing in the past few hours. XLM looks like it's trying really hard to breakout of the pattern above. If XRP continues north, XLM may follow.

XLM setup looks a little familiar.XLM looks to be setting up almost identically to a previous pattern seen previous to the last bull-run. If this pattern repeats, expect the next move to be much bigger than the previous move overall.

XLMUSD Forecast Pushing LowerThe XLMUSD might pulse up and fall at the M45 for a bias of 0.084 with one price target
Monitoring will be required and, It's a high-risk setup.
Have a lovely weekend, take care, bye bye...
.
Khiwe
On this profile page, the shared analysis, ideas, and strategy of a chart belong to Khiwe, with some being influenced. The technical setups are speculative; they are not guaranteed for accuracy or completeness in the form of any content, and they are not intended to provide financial market advice. Please apply your own analysis and confirm it with price action.
