XLMBULLUSD trade ideas

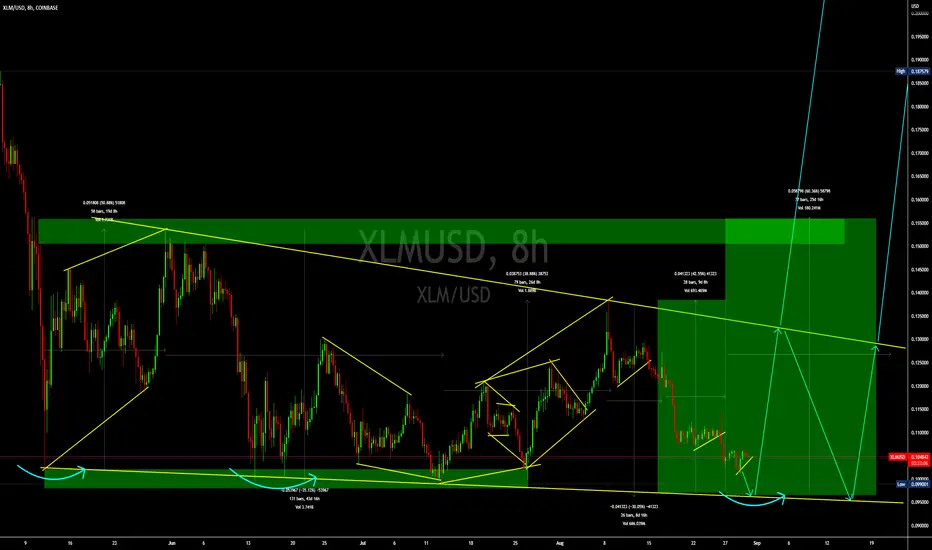
XLMUSD forming triangle pattern, growth after bullish breakoutXLMUSD
price is forming a triangle like structure, if price manages to break above the triangle and if price holds above the structure, I expect the price to move higher towards next resistance. if price breaks below the support area the the setup will be invalidated
Trade Wisely
*The content on this analysis is subject to change at any time without notice, and is provided for the sole purpose of assisting traders to make independent investment decisions.

Stellar UpdateUnfortunately it 'destroyed' the inflection level without any reaction and even accelerated down. May keep an eye on at 0.1065 as the RSI is lying on a support area. But await for a bullish signal to be triggered to reinstate the bullish scenario.

Stellar USD - Rounding bottomCOINBASE:XLMUSD is shaping a rounding bottom pattern on the lows, giving credit to a further rise. The Hourly-RSI keeps upside potential holding above the 40% critical support area.

stellar lumen versus ethereumI notice stellar didnt top its previous ath nd the bear market is much different for stellar now. this chart shows a bbwp indicator printing super low volatility , where in the past there was incredibly high volatility.
what the pattern both in price fractal 'shape' and pattern in volatility/momentum indicator tell me is a significant reversal could be occurring.


XLM looking upThere is a strong consolidation on the XLM coin. As a rule, before a strong movement. There is a level of $0.11. Below they are not allowed - this speaks of strength. In case of a positive recovery of the general market and fixing the price above the level of the descending wedge that indicated, consider opening a long position. But not at once. Because at such moments, false breakouts very often occur. Now more than ever, risk management is essential!

ARIASWAVE CRYPTO MARKET UPDATE - Tracking the Latest Price MovesIn this video I cover Bitcoin and XLM and talk about what I see happening over the coming months.
I believe we will see a relief rally sooner rather than later in these markets.
I have adjusted the count for Bitcoin due to the waves observed that the current lows.
Each wave that occurs in the markets gives off clues to the overall count which is why I've been patient.
If we are to expect some kind of rally, then it's best to understand which waves will cause it.
In the case of Bitcoin, it looks to be part of the corrective portion of Wave D of Wave 2.
In the case of XLM's potential to rally it looks like it is Wave C of Wave 2.
For now, it appears to be wise to wait for Bitcoin to at least trace out the start of a bear market rally...
Whereas in the case of XLM it looks like it has already displayed signs that the bear market rally has already begun.
Remember to use Disciplined Money Management Principles to ensure longevity as a trader.
If you don't know the long term pattern shouldn't you be doing your research instead of just following the crowd?
Just remember: I am not a financial adviser, I suggest using this only as a guide. Always do your own research.

Stellar XLM Impending Breakout!XLM is one of those assets that has just been beaten down again and again with no real push off of the lows. It's becoming too good of an opportunity for price appreciation and I believe it's primed for a breakout. Beyond some of the technicals I'm showing here there are also numerous fundamental reasons I think Stellar is overdue for some price appreciation.
A close above the 100 day MA would be bullish and likely cause a push up to .12 a close below will likely result in another visit back down into the .10 range. Regardless it's either up soon for XLM or off to new lows. A break and close above .12 on the daily would likely take XLM up to .15 then .17


XLMUSD forming traingle pattern, wait for a breakoutXLMUSD
price is forming a triangle like structure, if price manages to break above the triangle and if price holds above the structure, I expect the price to move higher towards next resistance. if price breaks below the support area the the setup will be invalidated
Trade Wisely
*The content on this analysis is subject to change at any time without notice, and is provided for the sole purpose of assisting traders to make independent investment decisions.

XLMUSD Near a Breakout? Stellar has poised itself like in the past above this diagonal green line
Comparable points in blue
Price may act as a falling wedge
I have seen this falling wedge on other charts for example EOS. Link to this EOS chart below

Perfect place for a stoplossHere's a quick little low risk trade that I came across on XLM. What a beautiful setup on a daily chart with a stop below yesterdays candle and a 10% take profit.

XLM/USD BULLISH VIEWXlmUsd might fly its at consolidation so we will enter buy once it break consolidation

XLM PRICE ACTION - Wave C of Wave 2 Now in Progress?As I continue to observe the markets, I see XLM continuing to perform as expected.
I do believe that we will be range bound for a while yet unless a couple of things happen mentioned in this video.
There is no real need to jump the gun in these scenarios...
As long as you continue to track the overall pattern even at the small degree it becomes clear what is likely taking place.
Right now, it appears as though we are simply in a Wave C bounce of the larger Wave 2 correction and the clues signal a potential bounce to around 24 cents.
But only if certain conditions are met.
Remember to use Disciplined Money Management Principles to ensure longevity as a trader.
If you don't know the long term pattern shouldn't you be doing your research instead of just following the crowd?
Just remember: I am not a financial adviser, I suggest using this only as a guide. Always do your own research.

XLMUSD RocketAs confident as I can possibly be. XLMUSD is about to rocket very soon. It will begin in minutes or hours, not days.

XLM is setting up for buy Hi there,
XLM is setting up for long.
Watch price action at bottom and look for short term long in case price rise sharply then look for longer term holding.
Good Luck
XLM PRICE ACTION - The Update You Have Been Waiting For!!!This video is the result of hours of analysis conducted by myself and one of my members mentioned in the video.
I performed a training session which not only helped him immensely but it also helped me identify the flaws in my analysis.
I think this is a great way to improve by helping others at the same time. It's a win win.
So it appears as though the pain has only just begun for the markets and we are unlikely to see any new all-time-highs until this large corrective wave is over.
There is absolutely no way of knowing how high the rest of this small degree correction will bounce but I can and will be tracking this extensively.
I believe there will soon be a perfect time to short sell XLM and other Cryptos.
This is an amazing turn of events for what started off as sharing my thoughts and ideas to now taking advantage of networking with other people to improve analysis and profits.
Remember to use Disciplined Money Management Principles to ensure longevity as a trader.
If you don't know the long term pattern shouldn't you be doing your research instead of just following the crowd?
Just remember: I am not a financial adviser, I suggest using this only as a guide. Always do your own research.

divergence on XLM STELAR LONG positionhello guys
xlm formed a three drive on decision point and this three drive make a divergence on rsi. so in my opinion this crypto is ready for a long position.
what do you think about this chart?
thank you for your attention!
If you agree with my analysis or you are happy, please hit the "like" button and "follow"!

Uptrend will continue!Good news. XLM has been consolidating for some time now, and it has shown a slow but steady progressive move north. If we continue the consolidation along the blue line, we should see a nice break out in the next week or 2. It could be sooner. XLM and its big brother XRP have are so coiled up, the spring is going to pop any day now!!!! Because our consolidation has inched us to the up side, I suspect both coins will rally hard very soon!! Guesstimate 20-30% gains. Just my opinion. Invest at your own risk comfort level.

XLMUSD - potential setupsCOINBASE:XLMUSD
👉 1. Price goes ABOVE the selected range on the picture. Long positions to activate.
👉 2. Price goes BELOW the selected range. below. Short positions to activate.
⚠️ Important Notes:
1. Follow your risk management rules.
2. Timeframes: up to H1

Potential setups for XLMUSDBINANCE:XLMUSD
👉 1. Price goes ABOVE the selected range on the picture. Long positions to activate.
👉 2. Price goes BELOW the selected range. below. Short positions to activate.
⚠️ Important Notes:
1. Follow your risk management rules.
2. Timeframes: up to H1

ARIASWAVE CRYPTO MARKET UPDATE - Initiating Launch Sequence...In this video I explore the potential scenarios for these Crypto markets.
They all seem to have one common theme as mentioned in my last Market Update.
We need to see one more new all time high to complete the cycle for Wave 5's across the board.
After that I believe there will be a time to take profits and consider what comes next.
So far it has taken time for each of these Cryptos to form these potentially bullish formations.
Let's see what the days ahead bring and whether or not we will see them continue to put some gains on the board.
Remember to use Disciplined Money Management Principles to ensure longevity as a trader.
If you don't know the long term pattern shouldn't you be doing your research instead of just following the crowd?
Just remember: I am not a financial adviser, I suggest using this only as a guide. Always do your own research.
