More proof Goldencross works immediately in this phase of bullJust like the char I posted before this one, I’m posting this simply to lllustrate how the golden cross (orange line crossing above the blue line) immediately resulted in a very pivotal bullish pump that coincided with a major fulcrum point on the chart recently on multiple different charts. More times than not in the other market cycles, when a golden cross occurs it usually takes a few weeks afterwards to know whether that cross will have its desired outcome or instead end up being a fakeout but lately I’ve noticed multiple charts have seen an instantaneous pump on the exact day of the golden cross, which is making me think that once we enter the 2nd parabolic phase of a bull market that that is when you can anticipate a golden cross to have its immediate intended effect its suppose to have with much much higher probability than all the other market phases including even the 1st half of the bull market. Anyways I wanted to illustrate that hypothesis here with the XLM chart as you can clearly see it’s a text book example, and I will try to put a link below to the previous example where this occurred as wel a link to the total2 chart which will have its golden cross in the next 102 daily candles.l One major reason I want to illustrate this is because within the next 1-2 daily candle closes the Total2 (aka altcoin market) chart is going to have its golden cross and it is currently trying to confirm the breakout upward from a cp and handle pattern which is a huge fulcrum point for it. So should the trend of instantaneous golden cross pump effects occurring the same daily candle as the cross itself, this could clue us into exactly when the real full on alt season will be about to kick off (which if correct, will be ignited by a big confirmation breakout pump within the next 1-3 daily candles). *not financial advice*
XLMBULLUSD trade ideas

XLM Stellar Lumens Tight potential pivot point for risk for a large move higher. Good risk:reward risking low of this daily candle

XLM Temporary downside then major upside XLM Temporary downside then major upside. We will go to the 50-61.8% fib retracement then head to the 141 which is $1.55

XLM/USD: Signs of Overextension and Impending CorrectionStellar (XLM) experienced a dramatic surge, skyrocketing from $0.09 on November 7 to a local high of $0.63 on November 24. This rapid rise of over 600% in just a few weeks indicates clear overextension in the market. Such sharp upward movements are often unsustainable without periods of consolidation or correction.
Current Market Context:
Current Price: $0.48
Recent High: $0.63
Key Support Levels: $0.36, $0.25
After hitting $0.63, XLM has pulled back to $0.48, a strong signal that the market may need a correction to stabilize. This retracement reflects profit-taking and waning momentum, both common after such parabolic moves.
Possible Correction Scenarios:
Moderate Pullback to $0.36:
The first likely scenario involves a pullback to $0.36, a key support level that aligns with previous consolidation zones. This would allow for healthy price action and create a foundation for future bullish attempts.
Deeper Correction to $0.25:
If selling pressure intensifies, XLM could retreat to $0.25, representing a more substantial correction. This level is critical for maintaining a broader bullish structure and could attract buyers looking for value.
Market Indicators:
The RSI (Relative Strength Index) shows signs of overbought conditions, suggesting further downside pressure.
Volume has also declined since the peak, indicating weakening buying interest.
In summary, the overextension from $0.09 to $0.63 signals a market that may need to cool down. The current decline to $0.48 underscores the likelihood of a correction, with key support levels at $0.36 and $0.25 in focus. A healthy pullback could reset the market for a more sustainable rally in the future.

STELLAR BULLISH MOMENTUM-XLMCRYPTO:XLMUSD
XLM Continuation Rally: An Analysis
Bullish Arguments:
PMH (Previous Monthly High) disrespected
PML (Previous Monthly Low) disrespected
Weekly Bullish FVG respected
PWL (Previous Weekly Low) disrespected
PWH (Previous Weekly High) disrespected
PDL (Previous Daily Low) disrespected
4H swing low disrespected
4H Bullish FVG respected
Bearish Arguments:
PDH (Previous Daily High) respected
4H swing high respected
Bullish 81.82%- Bearish 18.18%
Trade Management:
This setup involves high risk and requires close monitoring of price action. Use a tight stop-loss (SL) to manage risk, and aim for a take-profit (TP) near the 2021 ATH zone. Staying alert to market movements is critical for this trade

xlm 11$ by end of 2029holding 30000 xlm at price of 0,09$
not fa
just elliot wave
i have open long with x4 leverage from 0,10
trust the process
wave 3 is around 2-3$ in end of 2025

XLMUSD LONG. SWING ALTSEASON PROJECTIONXLMUSD LONG. SWING ALTSEASON PROJECTION
This is just my idea and opinion about the projection of XLMUSD pair, on the long term.
By the looks of it, and with the events coming up with the US elections, clarity in crypto regulations coming up, and also possible future ETF applications this could be few triggers for a Long position.

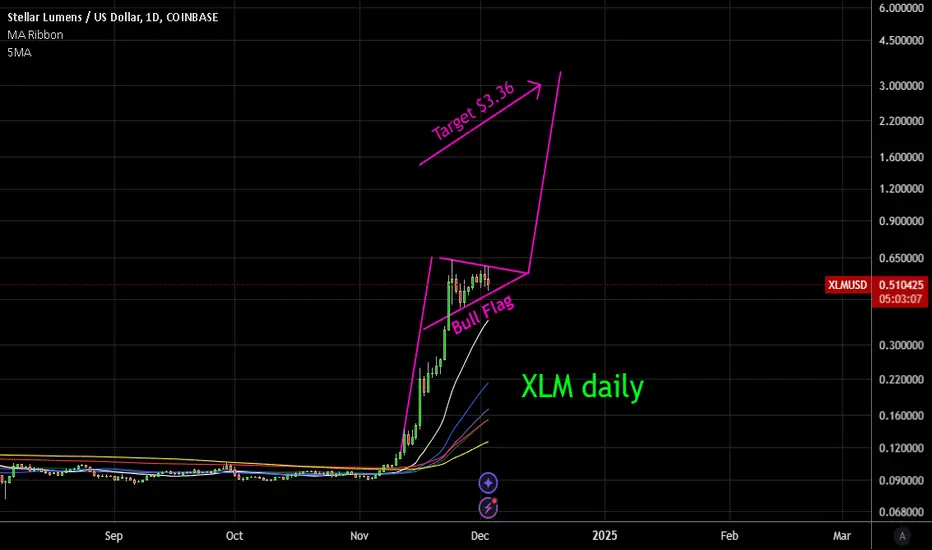
XLM Daily Bull FlagDaily chart of XLM with bull flag target of $3.36 usd. This is a 7x profit potential over the coming months. This is for educational purposes only, not financial advise.
XLM Short setup explained- Entry $0.58485After examining higher time frames, we can see XLM is inside the prior weekly supply zone which led to a BoS and large, sustained move to the downside. Inside the weekly supply zone we can locate a daily supply zone also responsible for the drop. XLM tapped the very bottom of this daily supply zone with its upper wick on this most recent move up as seen in the chart.
Zooming into the H4, we can see a clear failure to gain, hinting at a potential microtrend reversal. Further confirmation provided by price rejecting the level lost and being unable to close above the lower high. Price action remains bearish and we see range expansion with increased volatility come into play in the final 9-10 candles. This provides enough information for us to confidently trade our setup , which is explained further inside chart.
Let's see what happens.
Good luck, be safe, trade smart.
-Platoon

XLM BULLISH- Possible bullish pullback price movement towards the resistance 0.80$ within the next period.

Could This Bullish Break Take XLM to .95?!Let's break down what I see on COINBASE:XLMUSD on the 4Hr Chart!
Based on the Rally from the Low @ .089 to the Multi-Year High @ .633, we can see Price fell into a Pennant Pattern, First making a Retracement to .425 or the 38.2% Fibonacci Level to find Support then found Support again at .505 or the 23.6% Fibonacci Level.
Price has given us a Break of the Falling Resistance and upon the opening of the 4H & 1H Candle, Retested the Break of Falling Resistance.
Now the Rally generated from the Low @ .229 to the High @ .633 was a ~ .40 or 175% increase.
-If Bulls are able to hold Price above the .50 - .54 area, that .40 movement or potential 74% increase in Price from the Point of Break could lead us to the Potential Target of .95!

XLM Bull FlagXLM has a massive bull flag with $60 target on monthly chart. Also bull flags on smaller time frames targeting $8 and $3.

XLM - A reset after the steller movethis dino woke up one day and made a rocket move.
it has stopped its move for some time. meanwhile, it matched the equal lows and created a smaller high.
I am looking to short this thing.

XLM to make new ATHfrom the 5min timeframe we have a clear indication of a fair-value-gap order being filled. labelled as ffvg(Favourite fair value gap) as it happens to be just above the 200MA indicator as well. Already this is a clear indication on how ready the market is, and how much momentum the market is gathering to set new highs. Over sunday crossing over to monday I believe we would have seen new highs. Stay positive and know what you hold folks!!!

XLM where are WE going next? Hmmm Weekly evaluationThis weekly chart looks like a breakout buy. If it holds of course! Lots of buying pressure after the big shill sells! New buyers moving in... adding to my initial position which is still negative. Bought $100 around $0.55. Think this move just like XRP.

XLM short term trade idea!Not financial advice! Not a professional! Just trying to learn? lol
Now I will try to get in around 0.42?
Ride it up to around 0.80 maybe 0.93+ lol
XLM smokes XRP! lol
XLM will eventually flip XRP!
Remember the economist magazine January 1988

STELLAR (XLMUSD): Classic Trend Following Pattern
Stellar recently broke and closed above a key weekly horizontal resistance.
Retesting the broken structure, the price broke a resistance line of a falling
wedge pattern on a 4H time frame.
It indicates a strong bullish potential and a highly probable coming up movement.
I expect a growth at least to 0.6 level.
❤️Please, support my work with like, thank you!❤️

XLM $0.80+Not financial advice! Not a professional! Just trying to learn? lol
I will get in around 0.32-0.35?
Ride it up to around 0.80 maybe 0.93+ lol
When XLM rises 🚀 100%+
XLM falls around 50%
Then rise 🚀 then falls then 🚀 lol

XLM looking like a great idea.Bought higher but plan was only to wait. I am Bullish on crypto with no plans to sell. Only acquire right now. Price will melt up or down soon. Thanksgiving is the perfect time to soar like a wild turkey. Gobble, gobble : )
Always buying and not advice.

XLMUSD - mega pump soon and mega ultra pump 2027-2028it's all on the chart, huge upside potential. The price is globally squeezed into a triangle. Formed from two parallel channels, which are confirmed by their effectiveness at the points of their intersection, and after the change of trend.

XLMUSD - Wave E of Wave (B) Looks Complete - Time To Go Short...In this video, I break down how the wave patterns, as interpreted through AriasWave, suggest that it's time to short this market.
When I notice over-the-top predictions and media hype, it only reinforces my belief that we've reached a short-term top in this cryptocurrency.
Here I provide a detailed wave analysis to support my bearish outlook, making it easy for you to follow along.
If prices begin to decline from here, you can expect to see continued corrections along the way that play out in a similar manner.

XLM will fall & rise!Not financial advice! Not a professional! Just trying to learn? lol
I will get in around 0.35-0.38?
Ride it up to around 0.75?
When XLM 🚀 100%+ XLM drops around 40-50% Then 🚀 then drops then 🚀 😜

XLM back to .52XLM back to .52
Barring further downside to Bitcoin, XLM can bounce to the .52 level which is roughly a potential 20% gain from here
