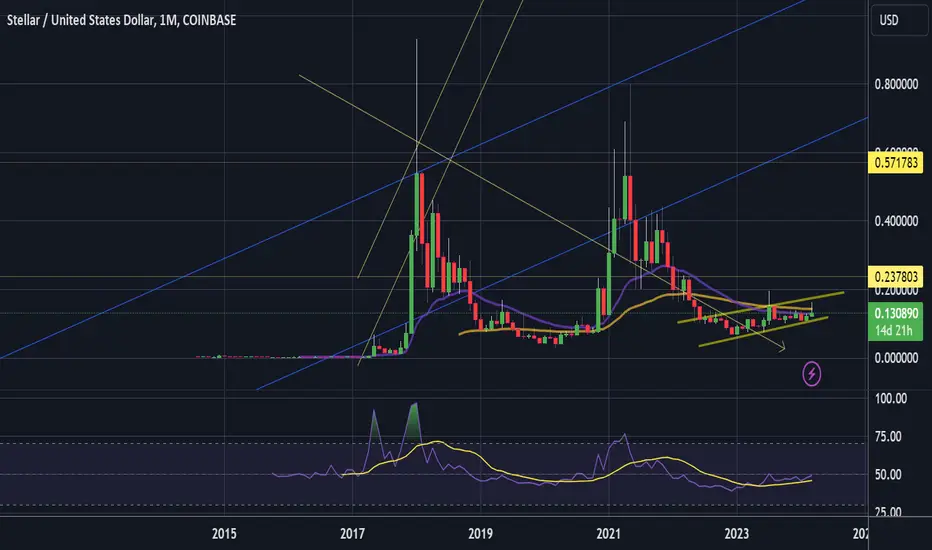
XLM points of interest Good support into the year. We could see heightened demand as crypto currencies continues its upward momentum. There has been no confirmed signal of downtrend.
CCI : 120 since posting. Usually a sign of demand.
RSI : Sitting at 49. Above 50 usually means there are more buyers than sellers.
And as always, stay vigilant. Set your stop losses accordingly.
XLMUSD.P trade ideas

XLM daily outlookFrom a technical analysis viewpoint there are a couple of things to note.
1: Elevated RSI
2: CCI showing signs of recovery and confidence.
And lastly....
3: Where are the sellers?
There is a positive outlook on stellar short term and long term.

🌟 Stellar Lumens (XLMUSD) - A Stellar Opportunity Beckons! 🚀Are you ready for a cosmic journey with Stellar Lumens (XLM)? Dive into a universe where data isn't just numbers, but the keys to unlocking potential good profits! 🌌
Current Market Overview:
Recent data highlights a dip in Stellar’s supply to 105,390,795,497.27 XLM. From a technical perspective, this contraction in supply can be a precursor to price increases as market demand starts outstripping available supply.
Big Data Insights into Stellar:
Supply Dynamics: The current supply is notably lower than the historical average, which often triggers a bullish sentiment among traders who anticipate scarcity-driven price jumps.
On-Chain Metrics Analysis: On-chain data shows a downtrend in activity, which paradoxically aligns with previous setups before significant price rallies. This apparent contradiction often signals savvy investors to position themselves ahead of potential uptrends.
Based on past patterns, this could very well be the calm before a significant price surge. Prepare for potential uplift as we've observed a median increase of 43.21% in Stellar's price following similar conditions in the past. 📊
Latest News Insights:
Optimistic Regulatory Developments: A new wave of optimism surrounds XLM as discussions on regulatory fronts show positive signs. This evolving sentiment can play a pivotal role in boosting investor confidence and catalyzing upward price movements. Catch the full story here.
Community and Tech Advancements: Stellar continues to enhance its network capabilities, focusing on cross-border payments. Such technological strides and community-driven developments are key to its long-term viability and market strength.
Why Stellar Now? 🌠
With tightening supply and favorable on-chain metrics paired with positive market sentiment and ongoing technological enhancements, XLM presents an interesting investment opportunity. Historical data and current market conditions suggest a bullish outlook, making now an ideal time to consider a long position. 🚀
Trade Mechanics:
1. Entry Point: Today! Stellar's current market dynamics suggest a tightening market.
2. Targets:
1 Week: $0.1139
2 Weeks: $0.1182
1 Month: $0.1336
3 Months: Shoot for the stars at $0.1627 🌟
Take Profit: Secure gains at $0.1587 .
Stop Loss: Safeguard your investment at $0.0869 .
What Makes This Trade Galactic?
Historically Solid: With documented instances of similar conditions, Stellar's setup shows a high success rate for gains.
Risk-Reward Ratio: Attractive with minimal drawdowns and significant potential upsides.
Conclusion:
The cosmos is aligning for Stellar, and the market indicators, enhanced by positive news and robust community activities, suggest a stellar journey ahead. Join me in this lucrative voyage through the financial universe with Stellar Lumens! Let’s navigate this opportunity together and potentially reap the rewards that the cosmos has to offer. 🌠

$XLM looks to repeat 2016-2017 price action?Look at the price action of 2016-17 and look at the current price action.
I just wanted to highlight the main points of correlation.
The trend lines are clones from the 2016 price action and fit well into the current price action.
The fractal is what the price action could be if it follows the pattern of 2016-17.
First major move top target is 1.8-2.8
Second major move top target is 18-28
The previous two cycles in XLM had major moves only after the bitcoin halving. Could this time be different?
If the time frames are to coincide with the 2016-17 price action, we should see the first top in 4 days, so that is by, April 17th.
I'm indifferent whether it happens or not, I'm just grateful to notice the similarities in the price action and be able to share this with the world.

19 Dollars a PieceIn the past 6-8 months every time I have published a bullish idea about XLM price has crashed vehemently with no shame in contradiction to all my ideas. So when you see an XLM idea on TradingView by me, it is in itself a signal to run away from this mad dog. On the other hand, I still think this scenario will play out. The price will not hit the highest trend line, but it will hit the one below it considering the target of the cup and handle is around 17-20 dollars a piece. Regardless of the outcome, I really think my trend lines are pretty and relevant to the price action all the way from 2014 up to now.

Crash Buy!!!! $50!!Everything is crashing I don't know why I am just buying!! The whole year of chains gone in a one day!! Buy! Buy! Buy!!!!!

Another look at the XLM chart.The current XLM chart leaves plenty of room available for major gains over the next 6 months to a year. XLM generally runs with XRP.
Good luck, and always use a stop-loss!

stellar vavesleading diagonal vave 1 in progress
currently in vave 5
target between 0.6 - 0.8
possible to spike to $1
nfa
y axis only

$XLM be ready for May/June 2024!#XLM is literally replicating what it did the last bull run. If you notice it will reflect the same exact time that I'm expecting other alt coins to move, around May or June 2024, when in my opinion the real bull run will start.
It's a great momentum for accumulation and to buy more of this coin that can do 300/400% easily.

XLM Upside?At this point, awaiting higher volume and some confirmation XLM can break out. Otherwise, this has been an unfortunately lackluster rally with XLM. Here's to hoping.

XLM InterstellarXLM Stellar Lumens weekly chart indicators showing possible signs of making a big move to the upside at any time. XRP ripples chart near exact comparison. Green arrow indicators set at market downtrend exhaustion levels on cypher b coinside with commodity channel index's bottoms and reversals shaded in yellow circles.

(XLM) STELLARStellar made an upside bridge in the past. The green line was flat and the red line created a convex negative by opposition of the price. Stellar is not XRP's little brother. Stellar is not XRP 2.0.

FractalI’m comparing March 2017 to March 2024, because I have run out of bullish ideas and this is the last thing that comes to mind. Look at the chart in the comment to see the comparison.

Will This Pattern Continue?This one looks like a broadening wedge to me, however the speed at which XLM's price has been unfolding is disgustingly slow and boring. Just in case if price tends to visit the top of the broadening wedge again, it is gonna be a 70-75 cent target, which is a massive resistance level.


Stellar XLM The biggest Moon 14.00 +XLM BULL PENANT/FLAG
This is just and idea. Why so stagnant? For years after years in regards to new ATH?! Because the pole upwards is coming!
XLM has been working and building in the background. Lately with the new Soroban contracts phasing out. XLM is becoming a Real World Assets commodity. The project and foundation has kept an ear to the damn US government in regards to compliance and regulation. In price action terms XLM is considered dead because it’s brewing up ready to blow off.
Don’t be deterred nor discouraged. I believe we are in a super cycle. If the pole breaks upwards and you held, though you may have traded the last bull run. You have to hold XLM’s bottoms on the pennant/flag.
The highest hopium is the highest risk. If it pays off, you’re rich.

XLM to 20+ $$$???If you measure the size from the swing high to swing low of the current wedge XLM is in to the supposed breakout you get a price point of 24$ plus some change. The 1.618 fib ratio of the first swing major high also gets you near to this 24$ target. When I have multiple indicators giving me the same price target it gives me more of a stronger confirmation that, that price target will be hit!!

#XLM/USDT#XLM
The price broke the downward channel and began to rise after breaking the downtrend with oversold saturation
The current price is 0.12800
Initial target 0.1328
A restriction that results in a correction in the price and then goes to
The second target is 0.14460
Then the third target is 0.16930
This rise is supported by oversold conditions

Stellar 33This chart has been a work in progress based on previous market highs. In 2018 I watched XLM 🌙 M00n to 0.96 usd. Fast forward to today, XLM has flipped eth on the treasury market.
Inverse H&S setup possabilityplain and simple idea. BTC retrace take consolidates money funnels to alts for some catch-up.

XLMUSD - Price Action Update - My Thoughts On This Choppy Mess..Whether you're a trader or a seasoned investor, I'm convinced this video will offer some insights, despite its erratic nature resembling that of a frenzied cougar with traces of monkey DNA.
While I maintain my faith in the long-term potential of XLM, its current state doesn't warrant much attention unless you enjoy the rollercoaster ride of price fluctuations on your screen while being unable to take any actionable steps.
Frankly, I wouldn't touch it with a ten-foot pole. Stay tuned for further updates.

How did I do? Called this channel out of a retest zone several days ago, seems to continue to range and then we will hit our next zone of $0.17-0.21. We are on track to be in this new zone roughly 7 days from now on March 21st.

Stellar XLM LumensSecond highest peak following the higher peak range using a fib support resistance block on graph. This adjusted view puts Stellar into playing with getting out of the red zone.
