Ascending TriangleI can't stop thinking about this ascending triangle. a simple ascending triangle in a very complicated and unpredictable market. while i'm bent on selling my xlm at 38 cents, i feel like there's a chance that this scenario is more likely to play out. I am considering a change of plans and set my sell target to 70 cents and then buy back at 42 cents. please do not listen to anyone on trading view. we're all a bunch of nobodies pretending to know how market behaves. it's all probabilities. nobody can perfectly predict market behavior. i share this because i like playing with charts. if you blindly follow this idea, there's a big chance you might lose your money. all of it.
XLMUSD.P trade ideas
XLM 0.17 or 0.38 or 0.69?IN @ 0.121700
I will ride XLM up to around 0.17 or 0.38 or 0.69?
Hopefully by Christmas! Soon very soon! :) lol
Around what price range do you see XLM going?
Comment

Stellar is looking bullish! The fib is on the line chart and you can see the candle bouncing off nicely gradually exciting the RSI to start moving possibly upwards. Stellar Lumens otherwise referred to as Lucifer is the master of deception, but not if you know his game-plan to dominate the world through these puppets at the CB(s), WEF, WHO and every participant in world government doing his bidding.
Get ready for the mark with your global passport infused with many variables that would allow you to move, buy, sell, healthcare etc. The last 3 years with Dr Bill Gates funding the WHO should be a wake-up call.
Woe to XRP too! Can you See the Writing on the Wall yet?
Stay Strong for: "Men's hearts failing them for fear, and for looking after those things which are coming on the earth: for the powers of heaven shall be shaken."
- Luke 21:26

Will XLM Fail To Surpass $0.135?Failed Inverted Head and Shoulder Breakout: XLM's price was unable to break out of an inverted head and shoulder pattern, indicating seller dominance at the $0.135 level.
Sustained Uptrend with Warning Signs: Despite retaining its uptrend momentum, XLM's price shows signs of potential bullish failure.
Critical Resistance at $0.135: The $0.135 level is proving to be a significant barrier for XLM, impeding its upward movement.
Potential for High-Speed Jump: A successful breakout above $0.135 could lead to a rapid price increase for Stellar, potentially reaching $0.1426.
Recent Price Dump: XLM recently experienced a 7.47% drop, struggling to surpass the $0.135 resistance and forming a bearish engulfing candle.
Incomplete Morning Star Pattern: A morning star pattern appears to be forming but lacks strong bullish momentum to confirm a positive reversal.
Current Trading Price: XLM is trading at $0.126, showing a slight bearish trend in the intraday chart.
Low Trading Volume: The lack of substantial trading volume indicates a potential consolidation phase or decreased investor interest.
Technical Indicators - MACD and RSI: The MACD indicator is indecisive, leaning towards a bearish crossover, while the RSI fails to show a significant increase in momentum.
79% Year-to-Date Growth: Despite the current challenges, XLM has shown a 79% growth year-to-date, maintaining a generally bullish trend for 2023.
Potential Future Moves: If XLM manages to break above $0.135, it could see a 15% increase to $0.1426. Conversely, a decline from $0.129 could lead to a drop to $0.1092.

Xlm stays strongXlm breaking away from the donwtrend channel, its clearly making a nice rounded bottom for a strong support, as long as the dow keeps going up with bitcoin this surely could be the next pumping.
IHS pattern on the daily, small cup and handle on the 4hour frame

Bull Market Indicator Moving AveragesThe 25 (orange) and 99 (blue) Moving Average Cross has been shown as an indicator for the bear and bull markets in XLM. usually when the 25 MA crosses the 99 MA in a way that the 25 MA is on top, it is an indication of the start of bull market. when the MA lines cross in a way that the 99 MA is on top it's an indication of a bear market. yesterday MA 25 crossed the MA 99 and is now on top, is this a signal for another bull market? I say, yes, but you shouldn't believe what people say on trading view and do your own research.

XLMUSD - Getting Closer To A Low.... New View...
I anticipate a gradual decline in prices from this point forward; however, I believe that XLM will outperform most major cryptocurrencies during this period.
Recently, a breakthrough in my analysis technique has allowed me to categorize each crypto, providing a clearer understanding of the patterns they are producing, with only two categories in existence. This breakthrough has empowered me to make significant adjustments to my analysis methodology, allowing me to closely align with the authentic pattern that XLM is forming. I no longer find myself guessing when deviations occur; the categorized framework enables me to make informed evaluations. This streamlined approach, thanks to the categorization, makes utilizing AriasWave even more straightforward in my analyses. Consequently, I can generate more ideas without compromising on quality.

Unrealistic-Not Impossible I came across this ascending channel and I think it’s interesting to look at. While a 20 dollar valuation for XLM in 2025 is unrealistic, it is not impossible given the nature of crypto market.

breakout watchno vaves on this but a cool looking inverted HnS
watch for breakout and push to around .26 in a fast move
nfa
y axis only

18 Month Old Inverted H&S1) we are sitting on an inverted H&S that started forming in May 2022.
2) with a structure like that, the tiniest target I can think of is no less than 28 cents a piece.
3) my other reason for believe we’re headed to 38-40 cents is that BTC is gonna push to 48k, and stabilize there giving way for the Alts to catch up.
4) XLM is not gonna catch by going to 17 cents or 24 cents. The only option is to hit the 38-40 cent level.
5) once we get to that level btc will start correcting back to 38k which is around 20% of correction for btc.
6) if btc corrects 20% then XLM will follow with a 36-40% drop (very normal and recurring event). The 40% drop of XLM from 40 cent is gonna be around 24 cents which is a 38.2% Fibonacci retracement level.
7) all of this needs to happen in a time span of a 7-8 week.
8) this is just a scenario that I think will happen. We all no there’s a high chance it will never happen, but I had to share the idea.

Can XLM ( Stellar ) do 25% move?As you can see XLM did higher high in July. Now it could be doing an H&S pattern. Closing the candle above the neck will be confirmation of a long position and I will be taking profits at those green marks.

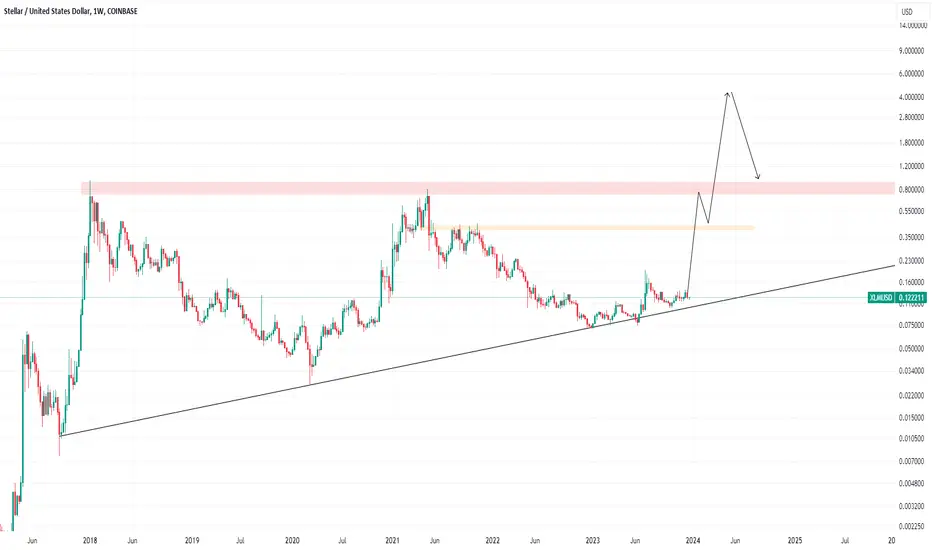
Them Sexy Monthly Candles In my last post about XLM, I pointed out that my sell target was around 38 cents. I still haven’t changed my target, but I was playing with the monthly chart and I just want everyone for a second to imagine a big giant green candle like this. A candle like this would be better than a thousand orgasms combined. The ascending triangle is drawn only considering closing prices of monthly candles. With that being said, if we want to visit the resistance trend line then the price would have to take itself to 53 cents a piece. Breaking out of this triangle is the heaven we’re all waiting to see.

XLM $0.170000 soon! :)I will ride XLM up to around $0.170000? & Get out!
What do you think XLM is going?
Comment below!
Much Love!

XLM?This what I think about XLM I will ride it up around 0.135000 get out & get in around 0.085000 That is when I will whale in lol.
+ lil trades here & there!
Comment!

Long Term OutlookHistory is not repeating. History is rhyming. The mini bull cycle in 2020 was wave 1, the bear market wave 2. We are at the beginning of wave 3. And I think wave 3-4-5 all are happening by mid 2025. My target for the top is 161.8% of wave 1, which comes out to about $17.

Stellar , pre bull prepration .Good afternoon lads , been doing some ta on stellar and as im adding some it ruined previous algo chart haha .
K lets dive to see whats with xlm ; its logaritmic chart and for the long term , i think that we’re going to have a good bullrun for stellar , took 116 bars from the top to the dip in previous cycle and this cycle almost 109 bars .
There’s an supersupport which we aint far from yet , what happens on the RSI made me think that explosion is imminent but im expecting a small dip before that , i go with breaking ath but not far from , and coming back beneath after the peak .
Stay safe fam .

My TOP10 project list - pick number 8/10We are now entering the last 3 top picks of my list.
These are no micro-caps anymore. These are solid blue chips that are already in the top30 of the overall crypto market.
Whereas I am only allocating 1% to the previous tokens (1-7) because they are highly speculative, I have allocated 14% of my crypto capital to this project.
No presentation needed for this project. It has been around since 10 years and will have its piece of the pie. There is no doubt in my mind about that.
The technical analysis is screaming "bullish": look at the Monthly chart ! Every time the RSI has crossed the SMA (simple moving average) - GOLDEN CIRCLES at the middle section of the chart, the price has dramatically increased (1st Feb 2017 - 1st Apr 2020 - and recently 1st May 2023).
The RSI cross is the first, early signal. There is a 2nd validation signal, that is the MACD (Moving Average Convergence Divergence) indicator. The PINK CIRCLE at the bottom of the chart. When this indicator make a cross momentum picks up steam. This indicator flashed on 1st July 2023 right before the news that Ripple had won in court agains the SEC (13th July 2023).
So, whatever people may say, Macro interest Rate narrative, Looming Recession, ... whatever ... WE ARE IN A BULL MARKET FOR XLM !! No doubt about it !!
Can there be an important correction / crash / drawdown of 50% ? Sure ! We have to be ready for whatever black swan event shows up. However it would probably be short lived and would not change the bullish overall momentum of this coin.
Hold steady. Be strong. XLM is in for extraordinary gains !

Going in Big on Stellar (XLM) - Target .18-.19 Cents!This one will be a longer-term swing. It may take weeks. It may take months. But the bottom line is that I like almost everything I see about this chart. Let's start all the way at the bottom. In mid-June price was at or near multi-year lows. RSI indicates we were way oversold. We started digging ourselves out of the hole then and haven't really looked back. That trend-line on the RSI is highly significant. Every time we've touched it our price has pumped. Our first touch was at the formation of the triangle bottom in mid-June at .07 cents. From June to July we went from .07 all the way up to almost .19 cents, nearly tripling. Every touch thereafter netted at least 30% from touch to top-out. And just recently, we have touched that sacred magical line once again. I believe this next pump is only beginning.
Now jump on up to the price chart. Feast your eyes on that beautiful ever-present bullish triangle. Isn't that amazing. But it's not just the size of it that I am excited about. Or the precision of touches to the top-side and bottom. Look at all those SMAs (50,100,200 day). Do you see how there all in the same area? And they are all providing us support rn. Additionally, just under all of them, we have a major horizontal TL. This provides us with a massive area of confluence that it become ridiculously hard to bet against.
I'm in at 11.8 cents with a SL comfortably under that last pivot low (9.5 cents to be exact). I will be taking profit along the way but will hold at least 25% of this trade to the final target unless I get stopped out of course. I will be raising my stops a comfortable distance along the way. Right now they are about 18% below my entry and I will draw them closer and closer to current price as we go. With any luck, we should be in the profit fairly soon and eventually so will my stops. Risk reward ration on this is 3/1.
None of this is fin advice of course. Just showing you all how I trade.
Best,
Stewdamus

📈 Stellar (XLM) Bullish Divergence Alert! 🚀Hey Crypto Fans! 👋
Big News! 📢 A bullish divergence has been identified in the daily charts of Stellar (XLM)! 📊🐂 This exciting development signals potential upward momentum for this innovative crypto! 📈
Let's dive into what makes XLM a star player: ✨
1️⃣ Speed and Efficiency ⚡: Stellar stands out for its incredibly fast transaction speeds and low fees, making it an excellent choice for practical, everyday use. 💳
2️⃣ Financial Inclusion 🌍: XLM's mission to make financial services accessible to all resonates with its vision of a more inclusive global economy. 💸
3️⃣ Impressive Partnerships 🤝: Stellar's growing list of partnerships indicates strong confidence from various sectors, boosting its application potential. 💼
4️⃣ Robust Technology 🛠️🌐: The underlying technology of Stellar is robust and scalable, setting it apart as a reliable and forward-thinking crypto solution. 💻🚀
What's the scoop on this bullish divergence? 🔮
This bullish divergence could be a key indicator of a positive shift in investor sentiment and market dynamics for XLM. It suggests that Stellar's price might be poised for a significant uptick, reflecting its strong fundamentals and growing adoption. 📈💥
Keep Stellar on your radar! 👀💫 The bullish divergence might just be the start of Stellar's ascent to new heights in the crypto universe! 🚀🌌
#Stellar #XLM #CryptoTrend #BullishDivergence #FinancialRevolution 🌐🎯💹🔥

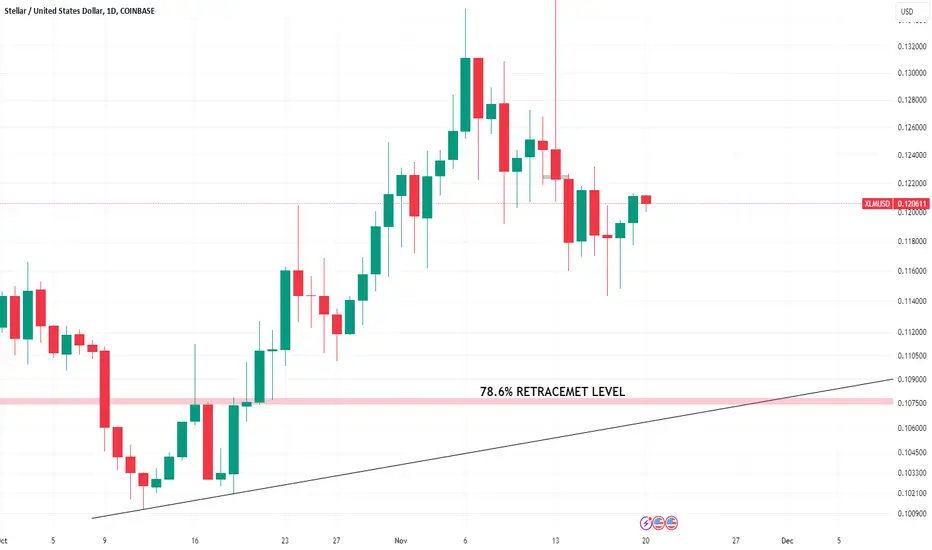
Simple But Risky Idea1) There is an established support trend line
2) If BTC drops to around 31k there's a high chance XLM price will fall back on this trend line.
3) there's also a chance for the XLM price to fall to 78.6% retracement level
XLM Stellar Lucifer about to reign! Sadly, the beast system.
Just goes to show you that the world elite have been planning this all along. No coincidences that they wanted a cashless society and one world gov for eons. Look at the cover of the 1988 Rothschild's publication "The Economist." Duh!... it says "Get Ready for a World Currency" on the cover with a picture of a Phoenix brandishing a bitcoin/XLM looking token that says 2018 around its neck with cash burning up at its feet. End times Mark of the Beast type sh!t right here, no doubt.

Stellar is set for the bullrun Steady inside 0.98 zone and waiting for a big surge.
No question asked. Seemed to be ready for a bullrun and first to reach $1.
It’s possibly can go a lot higher
Going long and longterm with XLMUSD

XLM. Return to '22 levels.Lumen's mid to long-term is a return to '22 levels and a return to the global ascending triangle originating in 2017. The ongoing smart contracts development, the launch of which is scheduled for early '24, will finally bring new breath into the chain. Keep your eyes on first decentralized finance protocols to launch on the network - they are flagships and will be like Uniswap for Ethereum.
