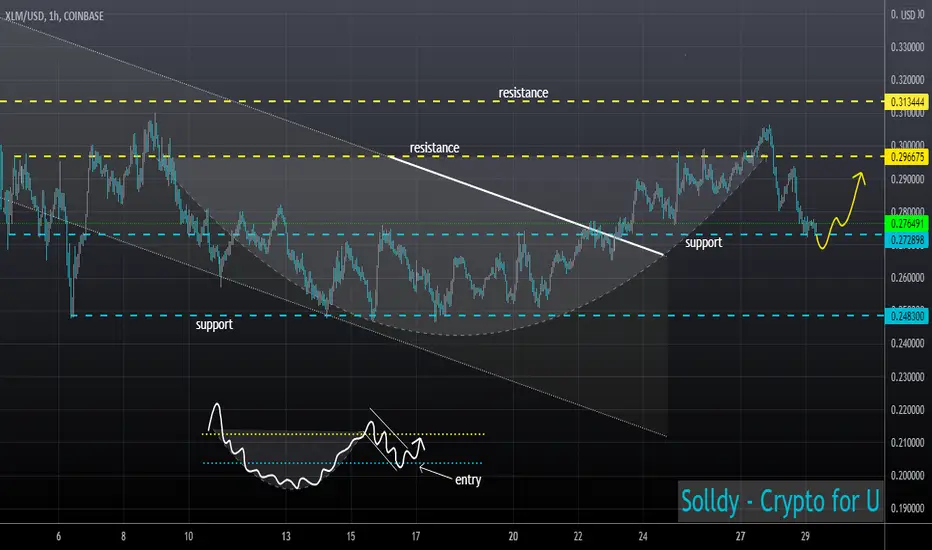
XLM pending BO above 0.30XLM seems found a good support at 0.26 zone. (refer to the circle & date)
next, XLM need to break and closed above 0.30.
if able to closed above 0.30, next resistance would be
0.35
0.40
0.42 (most important level)
DYODD.
XLMUSD.P trade ideas

XLM CUP(date) ON THE HANDLE - THE NEW(est) ANGLEXLM CUP(date) ON THE HANDLE - THE NEW(est) ANGLE
An update to my CUP & HANDLE ideas for XLM
These are just my angles on the pattern...
By no means the final survey
Sorry to spam the idea so much, i mess up alot before posting... i think i handle arc right now..jeesh

XLM CUP(date) ON THE HANDLE - THE NEW(est) ANGLEXLM CUP(date) ON THE HANDLE - THE NEW(est) ANGLE
An update to my CUP & HANDLE ideas for XLM
These are just my angles on the pattern...
By no means the final survey

XLM CUP & HANDLE - A NEW(er) ANGLEXLM CUP & HANDLE - A NEW(er) ANGLE:
Here is my new(er) angle on an XLM Cup & Handle
This is a revision of my previous idea "XLM CUP & HANDLE - A NEW ANGLE"
Which is:
A revision of my previous idea "XLM - ISHS to CUP & HANDLE"

XLM long term target for bullsXLMUSD analysis based on fib levels.
We expect XLM to hit 2 $ in 2022.
However, if the price breaks below critical support, it may get ugly for bulls.
XLM is one of those coins that didn´t do much in comparison to new coins such as Solana, AVAX, CRV and many more.
We believe that older coins such as XLM , BCH , EOS, XRP will shine soon. They say: Every dog has its day.
XLM bright days are coming
Good luck
Drop a comment if you find this analysis useful
No financial advice!

XLMUSD H4 Potential BuyBINANCE:XLMUSD
Hello traders
Here is the trade plan on XLMUSD H4 (Bullish Bias)
Market is trading aggressive Wave C/3 bullish on H4.
Apparently, bullish move have been confirmed with Trendline Break on Daily Chart.
We anticipate market to correct back to 0.27000 and 0.26600 levels for best entry (limit orders). As we actively watch the market, our market order and buy stop order are at hand for potential entries in case we get a shallow retracement.
On the presented Trade Plan, stop loss, entries and take profit levels are evident.
IMPORTANT
Trade Management is KEY!
#Capturing low hanging profits!

XLM - Hidden Bullish Divergence in the making?!Whales/elites will not miss any opportunities into making money. They simply buy the fear, hype up the market, take profit and crash it again after taking profit. Instead of beating then, lets ride with them! ;)
Before reading, get rid of your moonboy mentality and no emotions for dips/corrections! Cannot rule bearish scenarios! Dips are for buying!!
People are so focused on the hourly/daily timeframe that they get emotional on every dip! Take a step back to the weekly/monthly timeframe and see why I'm so bullish now. Stop looking at the short-term dips/rise. Short term is irrelevant for the move that is coming!
You can't be emotional in these markets (stocks, forex, crypto, real estate, etc.). You will lose this game following the news and doing what the majority does. News creates emotions. Everything you need to know are on the charts. News is manipulated by the elites, and they take advantage of our emotions. Stop listening to the news and pay more attention to the charts. Don't follow the majority, because the majority will lose in the end! Also, don't buy the hype when everyone is buying.. instead buy the fear when everyone else is selling
Everything is on the chart! Cryptocurrencies are on the verge of exploding higher. Dips/Corrections are normal and needed in a bull market and are buying opportunities! Huge gains opportunity in the coming months! Never trade blindly. Use multiple indicators to make calculated decisions. Trade with no emotions!
Facts:
1. Falling wedge may be in the making! March 2022 is the end of the wedge!
2. Hidden Bullish Divergence may be in the making! (Red Lines)
3. RSI - Highly oversold on the monthly! Also, may be creating a "Hidden Bullish Divergence"!?
4. Stochastic RSI - Awaiting Bullish cross on the monthly! Also, may be creating a "Hidden Bullish Divergence"!?
Buy Targets: $.23 - .26
Sell Targets: $1.65 - 2.92
"If you can't beat the fear, do it scared!"
"Be fearful when others are greedy, and greedy when others are fearful!" - Warren Buffet.
"Markets are a device for transferring money from the impatient to the patient. - Warren Buffet
"Show me the charts, and I'll tell you the news." - Bernard Baruch
"The secret to investing/trading is figuring out how rich you want to be and how poor you're willing to become."
"If you want to live like the 5% of the population who are hugely successful, then don't act like the 95%!"

XLM more price falls projectedMethodology from TradersReality YouTube
Tell TINO I sent you (NINETAILS)

XLM CUP & HANDLE - A NEW ANGLEXLM CUP & HANDLE - A NEW ANGLE:
Here is my new angle on an XLM Cup & Handle
This is a revision of my previous idea "XLM - ISHS to CUP & HANDLE"

XLM - BREAKOUT NEXT YEAR!XLM Could break out next year, once ALT season starts we could see XLM top of around $10-12 per coin!

XLM - CUP with a HANDLEXLM forms a CUP with a HANDLE.
While the handle is being formed, we need to wait for the breakdown of the handle line.
After the breakout, a strong rise above the resistance can be expected, up to about 0.300000.
Have a nice trade!
Your Solldy
XLM is ready to goXLM made an 88% retrace to perceived value areas and is now testing resistance at 30 cents. If this breaks above I'm expecting 35 cents shortly with future targets at 45 and 70 cents.

Stellar Lumens Bullish Reversal In EffectBottomed at .25 and being accumulated now for the swing higher to .45 🎯

XLM - ISHS to CUP & HANDLEXLM - ISHS to CUP & HANDLE
Moving to a ISHS target to complete CUP target
Moving to a HANDLE target
Moving to a completed CUP & HANDLE target

Stellar Long TermMy view about cryptocurrency Stellar. We are in uptrend, once it will break Resistance , price will go up . Once it will break Support , price will go down .


XlmusdThere was a formation of bearish expansion triangle ,buy the dip because xlm is going to pump so hard

XLM: Bounced off RSI trendline! Will it break out from triangle?Before reading, get rid of your moonboy mentality and no emotions for dips/corrections! Cannot rule bearish scenarios! Dips are for buying!!
People are so focused on the hourly/daily timeframe that they get emotional on every dip! Take a step back to the weekly/monthly timeframe and see why I'm so bullish now. Stop looking at the short-term dips/rise. Short term is irrelevant for the move that is coming!
You can't be emotional in these markets (stocks, forex, crypto, real estate, etc.). You will lose this game following the news and doing what the majority does. News creates emotions. Everything you need to know are on the charts. News is manipulated by the elites, and they take advantage of our emotions. Stop listening to the news and pay more attention to the charts. Don't follow the majority, because the majority will lose in the end! Also, don't buy the hype when everyone is buying. instead buy the fear when everyone else is selling
Everything is on the chart! Cryptocurrencies are on the verge of exploding higher. Dips/Corrections are normal and needed in a bull market and are buying opportunities! Huge gains opportunity in the coming months! Never trade blindly. Use multiple indicators to make calculated decisions. Trade with no emotions!
Facts:
1. We may be playing within the Symmetric Triangle. Awaiting breakout! If break to the upside, bullish targets are $1.96 - $3.05 before crashing!
2. RSI - Past Resistance turning into current Support! We are also highly oversold on the weekly chart!
3. Stochastic RSI - Just crossed on the weekly timeframe! Awaiting lines to cross the 20 level for bullish confirmation!
Buy Targets for Reaccumulating: Red Box (between 0.25 - .29). If this breaks on the weekly, 0.20 has strong support! Highly doubt we head this low!
"If you can't beat the fear, do it scared!"
"Be fearful when others are greedy, and greedy when others are fearful!" - Warren Buffet.
"Markets are a device for transferring money from the impatient to the patient. - Warren Buffet
"Show me the charts, and I'll tell you the news." - Bernard Baruch
"The secret to investing/trading is figuring out how rich you want to be and how poor you're willing to become."
"If you want to live like the 5% of the population who are hugely successful, then don't act like the 95%!"


XLMUSD: Long Trade From Key Level
This morning we spotted a great long trading opportunity on XLM coin with my students.
The market dropped to key daily structure support.
On that, the price formed a double bottom formation and broke and closed above the resistance line of a falling wedge pattern.
Now we see its retest.
I expect a bullish move to 0.306
❤️Please, support this idea with like and comment!❤️

XLM - Long Set Up Trade IdeaHope you find value from this post.
Here's an idea for setting up a long position with this asset.
==============================
Quick Disclaimer:
Trade at your own risk. This post/chart is for your reference only, it is not intended as a recommendation, nor is it an advise to buy XLM, nor to place any trade.
Trading poses a risk of losing some or all of your money and it will be your responsibility if you lose money.
==============================
Chart: 4 HR, Candle Sticks
Tools:
Extended Trend Line (Descending White Line)
Horizontal Ray Line (Dashed Yellow Horizontal Line)
Moving Average: 50 MA
MACD: Setting - 4HR TF (Time Frame)
Stoch RSI: Setting - 1Day TF
Rules:
1. Price must breakout of the White Extended Trend Line.
2. Price must go above and stay above the Yellow Horizontal Ray Line.
3. Price must stay above the 50 MA
4. MACD must have a Bullish Divergence
5. Stoch RSI should be coming from the Oversold Region and a momentum directed upwards.
(Currently, there is a Bullish Divergence present on both the MACD and the Stoch RSI.)
All rules must be fulfilled to be able to confirm an entry for a long position, otherwise it's a no go.
Once a position has been placed, it is...
VERY IMPORTANT TO PLACE A STOP LOSS (My preference is 2.5% - 3%)
Patience and Discipline are KEYS to a successful trade.
Trading is both a Science and an Art.
Develop an intuition and listen to your instinct while following the rules putting emotions aside.
If you have not yet developed it, you will develop this as long as you stay consistent with following
the rules. The skills will become second nature to you much like how you acquire the skill in riding a bicycle.
Soon it will be your subconscious running your trades, again, much like when riding a bicycle
the balance is controlled by the subconscious part of your brain.
Be PERSISTENT, and stay PERSISTENT.
Let me know what asset you wish for me to look at and evaluate for potential long set ups and I will post it here on TradingView.
If you found value from this post, consider giving it a like and subscribe. Furthermore, share it with someone you know will benefit from this.
Happy Yuletide Season!
More power to all your trades, my friends!
Ron
Intrepid_Trader


Crypto - Massive Re-accumulation or Total Collapse?It always boils down to this with crypto. It's a market of extremes, and this is reflected in today's volatility. Practically speaking I think any large whale preparing to take action on today's FED announcement has likely already sent their coins to an exchange and hedged accordingly. The market tends to price in future events, but cannot always foresee true paradigm shifts. Are cryptocurrencies part of a larger paradigm shift, or are they simply a bubble that has resulted from poor economic policy, rampant inequities, and globalization? If crypto is to collapse from here, it's going to be a massive retail exodus from the hyped altcoins of this cycle, and it would unfortunately put many established cryptocurrencies right back where they were in 2018-2019. Even Bitcoin could be pulled back to $14k or lower. So would big money really want this to happen, after the accelerated adoption and acceptance we've seen this year?
As I noted in my last analysis, many legacy coins are on long term support levels. Above, you can see XLM, NANO, LTC, and BTC. What do all these have in common? They are currency coins, and have less of a connection to other bubbles within the crypto sphere (NFT's, DeFI, etc.). Bitcoin has clearly done better than all three, though each of those altcoins has had significant improvements and hit major milestones over the last year. The amount of growth the Stellar ecosystem is experiencing right now is staggering. LTC is about to become the most liquid crypto asset out there with fungibility. NANO is being used to reduce costs associated with Ethereum mining payouts. I'm still holding these coins, for better or for worse. I do not want a collapse here because I think it would damage the space significantly in the longer term. I'd rather see evolution and maturity than complete erasure. It should be noted that institutions are likely NOT in a lot of the newer hyped projects. They're in Bitcoin, Ethereum, and to an extent other legacy cryptos like LTC and XLM. So these coins could be somewhat more indicative of where the big money is going.
I'm showing these charts in line form, rather than using candles or moving averages. This is to remove trader and trend bias. Moving averages for altcoins don't matter so much. It all depends on what Bitcoin (and to an extent, Ethereum) do. Based on these line charts, it is hard to tell the direction. On one hand, it looks like what we're seeing is just a smaller version of the 2017 bubble for these legacy coins. On the other hand, they're sustaining current prices for the longest period in their histories, and are maintaining a range higher than their previous range. This can be observed by looking at my horizontal levels on the charts above. If these new ranges continue to hold as support, these established coins can finally head to new all-time highs and exit these massive accumulation ranges. Below is an example of another coin that has mad significant progress this year (despite poor price performance). The yellow is what I'd expect to see form these other coins, should the current period turn out to be re-accumulation. The red is what I'd expect if Bitcoin has topped - new lows, even lower than 2018.
Here is actual Ethereum price action plotted against the speculative trajectory I drew back in February, 2021:
It's currently dipping below a trendline, and if it can't be reclaimed, it seems less likely Ethereum will see new highs. The next support would be back near $2k. If ETH manages to make a new high, I don't necessarily expect it to break $10k easily, and it may get stopped somewhere before then. All of this speculation is pointless if Bitcoin can't hold up here.
If Bitcoin cannot hold up here, it will likely pull down the coins shown on the main chart for this analysis, and they would likely have an extremely difficult time recovering. They could even be pulled down to 2018 bear market lows, especially if Bitcoin retests $9-14k. For these reasons, it's pretty important for BTC to hold these levels. Here is the current structure, as shown in my previous post. So, is this likely to happen?
The oscillator downtrend must be broken to confirm a "long" signal for traders, but here I'm really speculating on why things could play out in a certain way. My analysis is about understanding the nature of things and why they happen - not necessarily to predict. In the end, it's about not being surprised regardless of the outcome. Much of our anger comes from not understanding. Letting go can be cathartic. There are a lot of things we cannot control. I think understanding, empathy, and letting go are key to our happiness.
As for the market as a whole, TOTAL is still lingering near the highs from earlier this year. The fact that the market has experienced extreme fear while not being significantly down from ATH levels is honestly a little encouraging.
Let's see what happens! Over the course of writing this post, Bitcoin bounced to a new daily high within the local downtrend, so we could be seeing early signs of a reversal. A lot depends on buyer follow-through, and which narrative the media chooses to run with. Are cryptocurrencies the answer to inflation? Not so sure. If you correctly predicted high inflation and bought crypto a year ago, you'd be doing quite well at current valuations. But what about buying crypto DURING periods of high inflation? The demand for cash will need to settle as those who need the extra funds the most to pay down debt will sell assets first. But once that period ends...what happens? I actually think some of the stronger "currency" coins can see a resurgence in this environment, but I've been wrong about these coins plenty of times in the past.
This is meant for speculation and entertainment only - not financial advice.
On another note, there are a couple of projects I'm currently working on. Unfortunately I haven't had the time to put together a podcast yet, due to work and graduate school taking up most of my time. BUT, I have continued to work on my book, and I am also completing some historical chart-based artworks, which I plan to release in a very limited NFT collection. I believe there will be 25 in total, released 5 at a time. I figured some die-hard crypto enthusiasts would be into this sort of thing.
Thank you for reading!
-Victor Cobra
