XLMUSD : Long Term Bullish Ascending triangle. Target $5.7
On the Monthly chart XLM is forming a long-term bullish ascending triangle pattern with a first major target of $5.70.
The chart shows the ascending pattern has been forming since 2018, which makes this a long-term play for patient traders.
The ascending triangle pattern is a bullish formation identified by 3 or more previous resistance levels that form a flat top. This area is marked on the chart as points A, B, and C.
The ascending triangle also forms a series of higher lows that create a bullish trendline on the bottom. A bullish breakout occurs when the price breaks above the top resistance level, which is at $0.55.
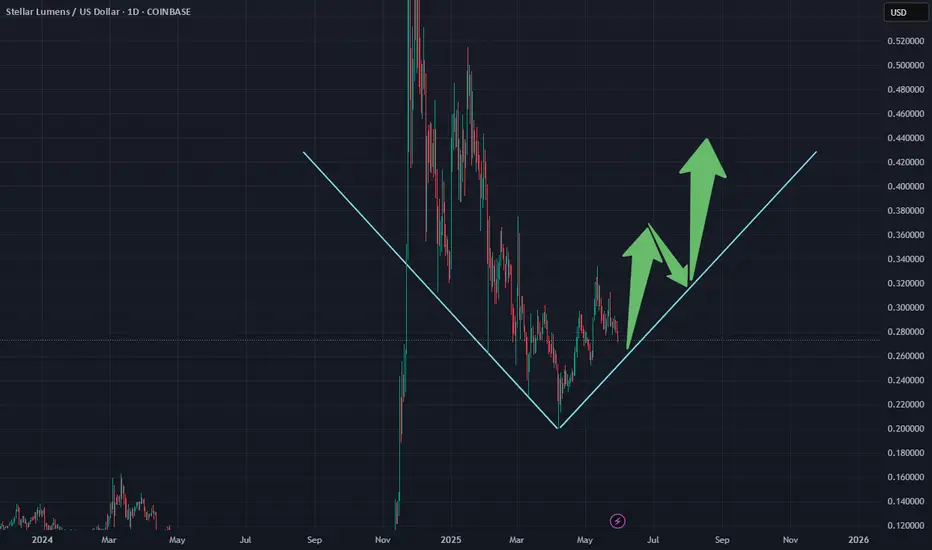
Note: If the price moves back down to form another higher low before moving back up, it can move as low as $0.155 before reversing upward.
This is a longer-term trade with a minimum 10x potential.
Why 10x Potential?
===============
The target of the ascending triangle is measured from the top of the back of the triangle (Point A) to where it meets the bottom of the triangle.
When this target (marked as 'Target Marker') is added to the top of the triangle, the target is actually $10.00;
However, for the sake of conservatism, I used Point B, which gives the move a target of $5.70 as the first major target.
Trading Strategies
What if I'm fearful?
======================
Great question! Then wait for a close above the top resistance at $0.55 before entering the long-term trade.
What if I'm feeling brave?
======================
Another great question! In this case, add to your position when the price touches the bottom trendline again.
What is This Bullish Ascending Triangle Pattern?
======================
Click on the charts below to see how this pattern has played out in other charts:
And
XLMUSD trade ideas

XLM – Bottom In, Eyes on $1+
XLM looks bottomed—hard to ask for a better setup than this.
Invalidation is clear: new lows. But as it stands, this is a clean weekly block retest that looks ready to launch.
From here, I’m expecting the move to begin.
See you above $1 CRYPTOCAP:XLM $XLMUSDT.

600% bullflag on XLM, massive wave part 2?Based on the LOG scale of XLM we see something very interesting happening, with a flat roof on the weekly and a clear W formation we can expect a possible nuclear upside.
This chart is set on the daily watching the channel with high accuracy S/R levels, we can also see the yellow line that was tested, swing failured and then tested AGAIN. giving us reason we might finally see the break of the channel to the upside, which could possibly... bring in the whales for a 600% move bullflag formation, breaking all time high and ushering probably the alt season.
Be ready!

XLMUSDT bearish 4hr time frameBTC is still in an uptrend but in a consolidation phase. However, many altcoins appear to be outliers and are significantly weaker when BTC is in a pullback phase. One of them is XLM/USDT, which is trading below the 100 and 200 MA on the daily timeframe.
A close below 0.25267 on the 4-hour timeframe may activate the pattern.
Targets are 0.215 and 0.195.
Invalidation: If it closes above 0.286.

XLM USDT on the weekly line chart... Flat roof resistanceThe chart speaks for itself... if this monster breaks from the smaller Daily pattern bullflag, it will catapult us into the larger ascending triangle formation that has been forming for 7 years...
This could be the final buy of the decade for XLM! DO NOT SLEEP ON THIS!

XLM READY FOR 40% GAINS!!!Hold onto your hats. We have been trading sideways for quite some time now. As you can see, we are running out of room. We Already have a double bottom and have great support. PayPal is going to push us to the moon, but for now, 40% gains feels pretty good. If you look at my ghost feed you will see we will probably trade in this range until the 3rd week of July; however, I won't rule out a run as early as next week. They may continue to push it down to the lower part of the triangle, but don't be fooled, you can see inside my forecast box that there is greater chance for bullish activity than bearish. Have a happy fourth y'all!

Stellar Lumens to light the way for Alt Season?Like many alt coins, XLM has broken out of a bull flag, then went sideways while BTC's price action wouldn't allow altcoins to go up much, and now it's broken out of a two-month long downtrend. If it's able to get above the cluster of EMA's then the party is on. TP at the fib levels, but keep a little in case it goes for new ATH.

XLM might catapult after this ADAM & EVE local bottom This ADAM & EVE might be the snowball effect for the spacejump of the bullflag pattern on the LOG scale bringing XLM to its previous rush high and probably beyond... A minimum increase of 150% is likely when this breaks with strength!
BEWARE!

Is The Bottom In For XLM?Stellar Lumens (XLM) is exhibiting strong bullish momentum supported by favorable technical indicators, resilient support zones, and growing investor sentiment around utility-driven altcoins. The recent rebound off the $0.24 support level marks a significant higher low on the daily chart, reinforcing the continuation of the medium-term uptrend that began in Q2 2025. This rebound occurred with increasing trading volume, signaling renewed accumulation and a potential shift in market structure from consolidation to expansion.
I firmly believe the bottom is in, and the next leg up is upon us.

XLM Stock Chart Fibonacci Analysis 062325Trading Idea
1) Find a FIBO slingshot
2) Check FIBO 61.80% level
3) Entry Point > 0.24/61.80%
Chart time frame:C
A) 15 min(1W-3M)
B) 1 hr(3M-6M)
C) 4 hr(6M-1year)
D) 1 day(1-3years)
Stock progress:A
A) Keep rising over 61.80% resistance
B) 61.80% resistance
C) 61.80% support
D) Hit the bottom
E) Hit the top
Stocks rise as they rise from support and fall from resistance. Our goal is to find a low support point and enter. It can be referred to as buying at the pullback point. The pullback point can be found with a Fibonacci extension of 61.80%. This is a step to find entry level. 1) Find a triangle (Fibonacci Speed Fan Line) that connects the high (resistance) and low (support) points of the stock in progress, where it is continuously expressed as a Slingshot, 2) and create a Fibonacci extension level for the first rising wave from the start point of slingshot pattern.
When the current price goes over 61.80% level , that can be a good entry point, especially if the SMA 100 and 200 curves are gathered together at 61.80%, it is a very good entry point.
As a great help, tradingview provides these Fibonacci speed fan lines and extension levels with ease. So if you use the Fibonacci fan line, the extension level, and the SMA 100/200 curve well, you can find an entry point for the stock market. At least you have to enter at this low point to avoid trading failure, and if you are skilled at entering this low point, with fibonacci6180 technique, your reading skill to chart will be greatly improved.
If you want to do day trading, please set the time frame to 5 minutes or 15 minutes, and you will see many of the low point of rising stocks.
If want to prefer long term range trading, you can set the time frame to 1 hr or 1 day.

Descending ChannelXLM has been stuck in a descending channel since December 2024 (7 months now). For XLM to form a reversal it needs to hold onto orange support level. If XLM loses this support, then the next level of support will be at the bottom of the descending channel, which is around 15-17 cents. If XLM manages to form a reversal around the orange support, and break above the descending channel, then the initial target will be 0.6 - 0.8 USD.

DECISION TIMEXLM had a beautiful falling wedge
pattern that actually broke up and
out of the wedge however it failed
to hold the back test of support.
What does this mean? Well...in
layman terms...we are headed for
lower price action. You see....ladies
and gentlemen...it's quite clear to
me the BTC maxi's are keeping BTC
dominance high in order to keep
wrecking your XLM trade. So...sit
back and relax. Let these next moves
come to you. Don't fret. Put in a spot
trade @ .19 cents and wait for the mother
of all trades to come in at around .11 cents
I will be going ALL IN on a 5x leverage trade
once we hit the lower target. Take care!
********** HAPPY XLM HUNTING ***********

XLM Stellar (XLM) Strategic Partnerships
Stellar boasts a strong network of partnerships with major financial and technology institutions, strengthening its position in cross-border payments and decentralized finance. Here are the most prominent of these partnerships and their impact:
1. Partnerships with Global Financial Institutions
- Mastercard: 🌟
Goal: Integrate Stellar technology into Mastercard Crypto Credit solutions to facilitate secure peer-to-peer transfers.
Impact: Promote acceptance of XLM in everyday transactions and expand its use among consumers.
- Franklin Templeton: 🌟
Goal: Use the Stellar network to manage the US Government's OnChain Fund (assets over $270 million).
Impact: Increase institutional confidence in Stellar as a transparent and low-cost asset management platform.
- MoneyGram: 🌟
Goal: Enable stablecoin transfers (such as USDC) across the Stellar network, while supporting cash withdrawals and deposits at MoneyGram branches globally.
Impact: Expanding financial services in developing regions, particularly Africa and Latin America.
2. Partnerships with technology and payment platforms
- Circle (USDC): 🤖
Goal: Issuing the USDC stablecoin on the Stellar network, enhancing network liquidity and facilitating cross-currency exchanges.
- IBM: 🤖
Goal: Developing the global payment network "WorldWire" using the Stellar core protocol.
- Visa: 🤖
Goal: Supporting Visa cards linked to Stellar wallets, particularly in emerging markets such as Kenya and the Philippines.
3. Partnerships with innovative institutions
- Paxos: 🏬
Goal: Accelerating the adoption of regulated stablecoins for financial institutions via Stellar.
- Deloitte: 🏬
Goal: Developing blockchain solutions to improve the efficiency of financial operations.
- ZettaBlock: 🏬
Goal: Simplify building applications on Stellar through innovative developer tools.
👐 Marketing Strategies and Ecosystem Adoption
Stellar relies on three main pillars to expand its impact:
1. Focus on Financial Inclusion
Emerging Markets:
Stellar targets regions with weak banking sectors (such as Africa) through partnerships with platforms like Tala and Solar, which provide Stellar-based digital wallets.
Incentive Programs:
The Stellar Development Foundation (SDF) offers grants to developers to build payment applications and DeFi projects on the network, such as the Brilliant on Stellar Challenge.
2. Enhancing Decentralized Finance (DeFi) Infrastructure
Upgrading Smart Contracts (Soroban):
Stellar launched the Soroban platform in 2025 to support more complex smart contracts, designed in Rust to ensure security and efficiency.
Cooperation with OpenZeppelin to audit smart contract security.
Attracting Stablecoins:
New stablecoins like USDY (from Ondo) are joining the network to enhance liquidity.
3. Expanding Institutional Partnerships
Leveraging Big Brands:
Stellar uses its partnerships with Mastercard and Franklin Templeton as case studies to convince other institutions to join.
Focusing on Central Bank Digital Currencies (CBDCs):
Stellar partners with governments like Ukraine (via the Stellar Aid Assist program) to efficiently distribute financial aid.
Impact of Partnerships on XLM Price and Adoption
Payment Partnerships: Increased daily trading volume ($256 million), strengthening XLM's position as a bridge for small-value transfers.
Decentralized Finance: Attracting new projects like DEXs and NFTs, transforming Stellar into a full-fledged DeFi platform.
Stablecoins: Increased USDC liquidity on the network, reducing XLM's dependence on market volatility.
Competitive Challenges
Competing with XRP:
Ripple offers similar cross-border payment solutions, but Stellar excels with its broader institutional partnerships and energy efficiency.
Regulatory Fluctuations: Restrictions on stablecoins (such as USDC) may impact network growth. BINANCE:XLMUSD.P

XLM first a shortWell, looks like we had an impulsive wave up for the wave 1. Now correctiong, Looking to short for a nice 23%. The take position for the bigger and sickest wave 3.

BE VIGILANT HEREWith the unrest in the Middle East
we are testing the lower support
band on XLM. My worry here is we
break the lower line of confluence
and it becomes resistance. If so,
I would plan on taking a HUGE long
margin trade on XLM around .1203
I have my BUY limit 20x orders set
@ 12 cents. Not financial advice.
USE your best judgement here and
be patient and wait for price to come
to you! Chill out in this area. A retest
of .36 cents would be a HUGE positive
for XLM however, there could be quite
a bit of volatility in the coming months.
Good Luck and...
********* HAPPY XLM HUNTING *********

XLM - ready for last leg upXLM is repeating impulsive pattern from 2017. After creating accumulation range we got the breakout, formation of bull flag which tested top of accumulation range and we are now ready for last leg of this impulsive move. In 2017 last leg went equal meassured move target aka fibb 2.0 extension. Same move in current conditions will bring XLM price to 2$ range.
RSI also confirms this move. After hitting RSI overbought +90 level we got a pullback to middle 40 range - same move we did in 2017 before last leg up - this RSI also implicating one more push to RSI +90 overbought conditions and then big correction back to oversold conditions - if price will sit above diagonal resistance line at that moment that will be super bullish....

Bidding XLM Under 30c – Easy 2x From here!
Bidding this area under 30c—starting to like how things are shaping up.
Easy setup, especially with BTC aiming for 110k again.
If momentum fades and the market pulls back, I’ll cut and look to re-enter sub 20c on a key retest.
CRYPTOCAP:XLM gets really interesting above 65c—if it breaks that, expect strong follow-through. BINANCE:XLMUSDT

XLM break out ??Potential break out of falling wedge for XLM
Larger Volume on break a good sign, has retested breakout level.
needs to start moving higher and break that second consolidation zone or risks falling back into old patten.
what do you think? leave a comment.

Long on XLM — Breakout Brewing?Stellar (XLMUSD) just pushed above the Ichimoku Cloud with conviction and strong daily momentum. Price action is clean, riding above the Tenkan and Kijun lines, and volume is picking up. A close above $0.31 could confirm a breakout toward $0.44, with a longer-term extension possible to $0.62 — nearly a 2x move from current levels.
Technical Highlights:
✅ Ichimoku breakout: clear sky ahead
✅ Higher highs and higher lows
✅ Bullish momentum across MACD + structure
📈 R1 Target: $0.44
🛰️ R2 Target: $0.62
🛑 Stop: Below $0.27
If Bitcoin holds steady, XLM could run hard. Watching for continuation above $0.31 with volume. Let’s ride the wave. 🌊
#XLM #Stellar #Crypto #Altcoins #Ichimoku #Breakout #TradingView

Points of deflection...AKA "BOUNCE"Bounce baby..that's right!...not Beyonce!...BOUNCE!
XLM on the move UP. Don't be troubled
by BTC's retest of the 100k area. That
is healthy and we should see a strong
bounce around that 100k zone. Time to load
up on your favorite ALTCOINS. As the old
saying goes...a rising tide raises all ships.
Wait till this baby really takes off! This is
just a rough estimate as to where price could
bounce in the next week or two. Not much
time left in this bull cycle. Don't buy into the
"this time is different" BS. We will probably top
out around October 2025 so I will be positioning
myself early on these trades and taking profits
along the way UP. Good luck and....
********** HAPPY XLM HUNTING **************
XLMUSDT short Wait for Good EntryLike & Follow me for more details
GLMR Short,
BTC will break upward trend soon.
Will reach 103k

XLMUSD Huge breakout may happen any moment.Stellar / XLMUSD is testing the 6 month Falling Resistance again, while trading inside a Channel Up.
The 1day RSI is in strong support of this move and may force a 1day candle closing above the Resistance finally.
If it happens, go lonh and target 0.3650 (+32.79%).
Previous chart:
Follow us, like the idea and leave a comment below!!

XLM/USD Stellar Heist: Snag the Bullish Breakout Loot!🚀XLM/USD Stellar Surge Strategy🚀
Hello, Wealth Warriors & Market Mavericks! 💸 Ready to conquer the Stellar vs. Tether (XLM/USD) crypto battlefield? 📊 This *Cosmic Trading Blueprint* fuses razor-sharp technicals with real-time market pulse to chase a bullish breakout. Follow this strategy, ride the wave, and exit before the Danger Zone strikes. Let’s bag those profits as a squad! 🤝🎯
📈 **Strategy Snapshot: XLM/USD Stellar**
- **Market**: XLM/USDT (Crypto) 🌍
- **Bias**: Bullish Breakout ✨
- **Timeframe**: 6h (Swing Trade) ⏳
**Entry Points** 📡
- **Breakout Entry (Entry 1)**: Spot the breakout above the 50-period MA at 0.33500 and dive in—stellar gains await! 🚀
*Smart Tip*: Place buy stop orders above the MA or buy limit orders at the latest 15/30-min swing low for pullback entries. 🔔 Set a TradingView alert for the 0.33500 breakout to stay ahead of the game!
- **Pullback Entry (Entry 2)**: Wait for a dip near 0.32500, confirmed by bullish price action, for a safer entry. 📉
**Stop Loss** 🛡️
- **Breakout Traders**: After breakout confirmation, set Stop Loss below the recent 1D swing low at 0.28000 to guard against reversals. ⚠️
- **Pullback Traders**: Adjust Stop Loss based on risk tolerance (e.g., 1-2% of account), factoring in lot size and multiple entries. 📏
- **Risk Note**: This trade’s high-energy! Keep position sizing disciplined to protect your capital. 🔥
**Target** 🎯
- Aim for 0.45000, near the Danger Zone (overbought area prone to consolidation or reversal). 🏁
- **Exit Strategy**: Take profits early if bearish signals (e.g., high volume, reversal patterns) emerge near 0.45000. 💰
**Scalpers** 👀
- Target quick long-side scalps with tight trailing stops. Pair with swing traders for the full strategy or snag fast profits if capital allows. 💵
📊 **Why This Trade Shines (May 18, 2025)**
XLM/USDT is poised for action, driven by:
- **Technicals**: Breakout above the 50-day MA (~0.33500) with higher lows on the 4h chart signals strong momentum. 📈
- **Sentiment Analysis (May 18, 2025)**: Web sentiment shows 70% positive buzz for XLM, with altcoin hype growing. Fear & Greed Index at 74 (Greed), urging caution near overbought levels. 😎
- **Fundamentals**: CFTC’s COT report (May 16, 2025) indicates a 10% WoW increase in institutional long positions in crypto futures, reflecting big-player optimism. 📰
- **Seasonal Advantage**: Q2 historically boosts altcoins, aligning with this setup. 📅
- **Market Dynamics**: USD weakness (DXY down 0.9% this week) and altcoin strength fuel XLM’s upside. 🌎
⚠️ **Risk Management: Secure Your Gains**
- **News Caution**: Avoid new trades during high-impact events (e.g., CPI, FOMC) to dodge volatility spikes. 🗞️
- **Trailing Stops**: Activate trailing Stop Loss as price approaches 0.42000 to lock in profits. 🔒
- **Position Sizing**: Limit risk to 1-2% per trade for a steady strategy. 🚨
💥 **Launch the Surge!** 💥
Join the *Cosmic Trading Blueprint* crew—like, comment, and follow for more dynamic trade setups! 🚀 Your engagement fuels our market quests, driving precision wins. Let’s crush XLM/USDT together! 🤝🏆🎉
**Stay Ready**: Another stellar plan is in the works. Keep your charts primed, traders! 🐱🚀😎
📡 **Real-Time Data (May 18, 2025, UTC+1)**
- **XLM/USDT Price**: ~0.33200 (aggregated exchange data).
- **COT Report (May 16, 2025)**: Institutional long positions in crypto futures up 10% WoW, per CFTC.
- **Sentiment**: 70% positive, Fear & Greed Index at 74 (Greed).
- **USD Index (DXY)**: Down 0.9% WoW, supporting altcoin momentum.
