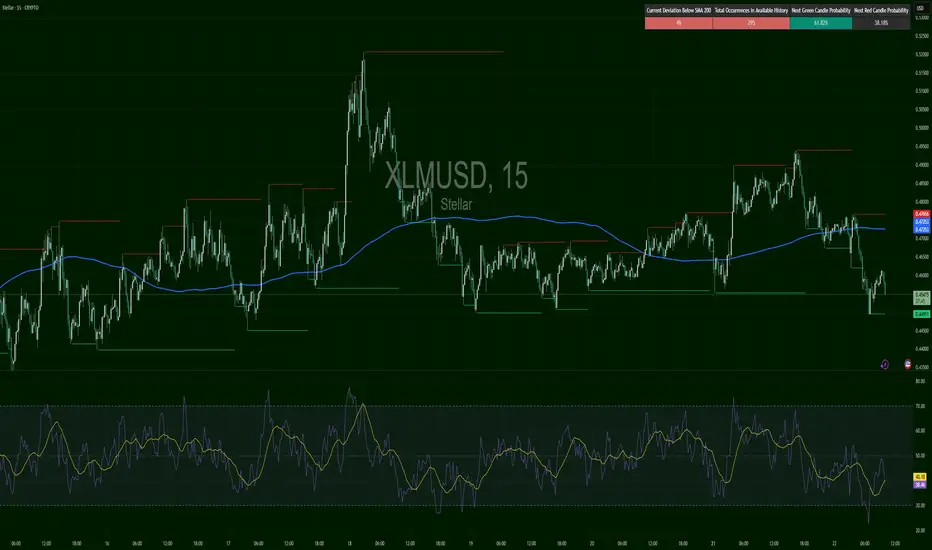
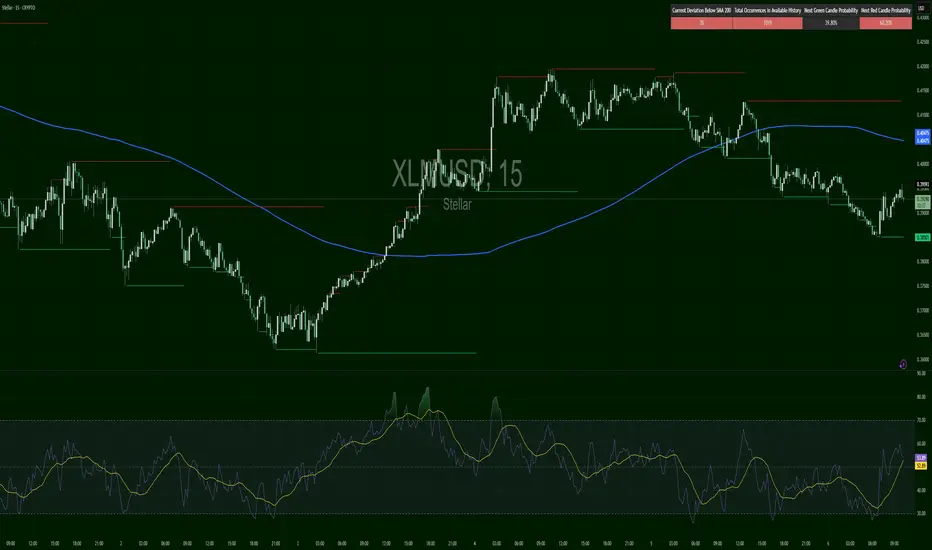
XLMUSD – Ripping Through OrbitBreakout confirmed, with price up to $0.41824, now resting against resistance at $0.41843. RSI is hot at 65+, and the probability model gives a 70% chance of green continuation — the highest among your current tickers.
XLMUSD trade ideas
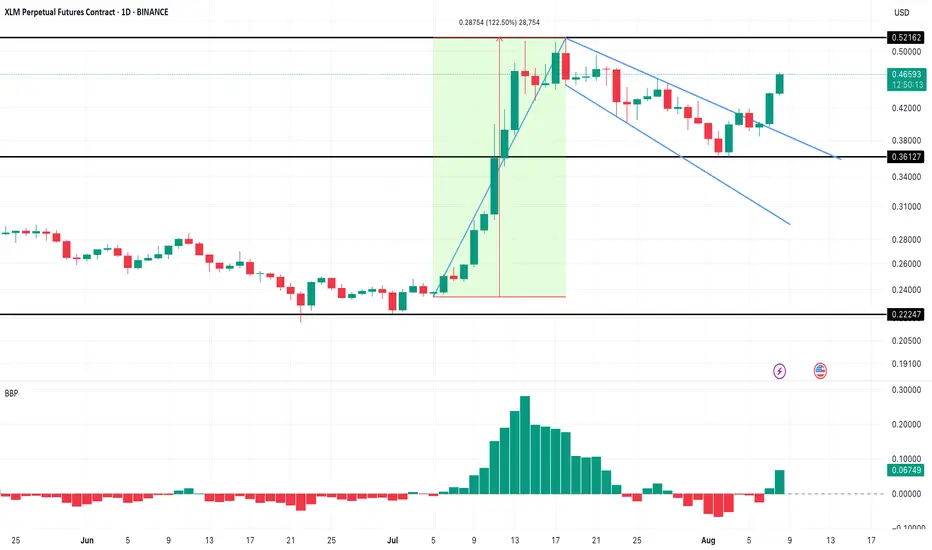
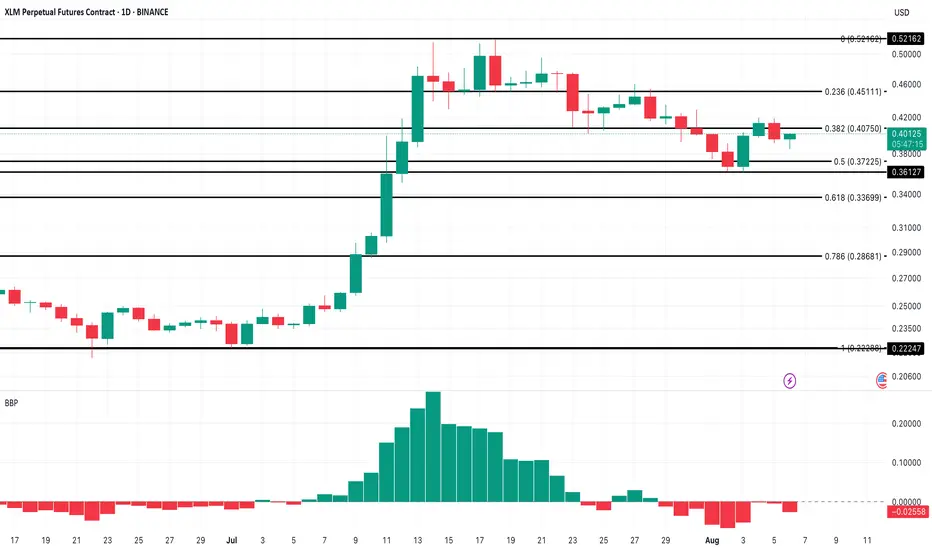
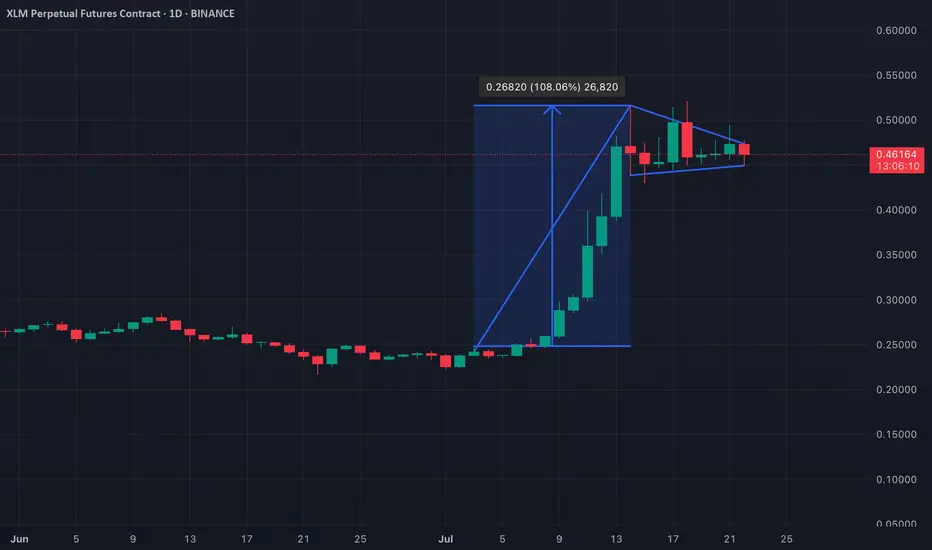
Stellar (XLM) Breaks Out of Bullish Flag: $0.97 in Sight?BINANCE:XLMUSD.P Stellar (XLM) has broken out of a classic pole-and-flag pattern on the daily chart, rallying over 16% in 24 hours. This continuation setup typically leads to further upside, and the measured move from the $0.23–$0.52 pole hints at a potential extension toward $0.97, provided bulls defend current levels.
While the 4-hour triple EMA crossover strengthens the uptrend case, a sharp 1,159% spike in exchange netflows could indicate early profit-taking pressure. This pattern of inflows has historically led to short-term dips. Still, the Bull-Bear Power (BBP) index flipping green adds conviction to the breakout.
Upside targets to watch: $0.52 (swing high) and $0.97 (extension). Invalidation if BINANCE:XLMUSD.P price closes below $0.36.
XLM over sold on RSI daily .36 next stop then explosionXLM over sold on RSI daily .36 next stop then explosion

Stellar lumens the most bullish chart in all of crypto $4 soonnuff said, if yall don't see whats happening , you hate money.

This is the same fractal for XLM from April 2017.The Fractal from April 2017 is repeating with the November Pump and the recent pump as well.
Next comes a dip and then another pump up to $1

Xlm bounce off my T2 confirmed. Is Xlm now going lower to my T3I was hoping for a larger rally after this anticipated bounce off my T2. But if Xlm doesn't hold support above $0.42, I believe Sui is going lower towards my T3.
I will post my T3 target if/when Xlm holds resistance below my recently hit T2.
May the trends be with you.

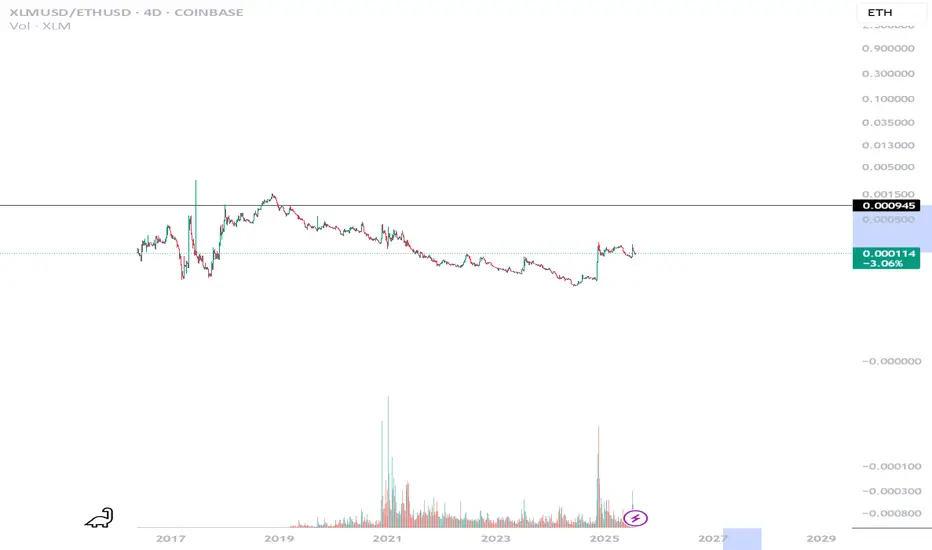
Expect a 730% rally XLM VS ETHThis is a XLM VS ETH Chart, I'm selling for XLM for ETH after XLM runs first expecting 726%
XLM/USD – Glow Faded FastStellar had a beautiful rally—until it didn’t. Price lost the $0.4080 key level and sits well below the 200 SMA, confirming a bear-biased market. Current bounce toward $0.3950–$0.4000 is technical and weak, lacking follow-through or strong RSI signals (still under 52). This remains a fade-the-rip setup unless buyers force a structural reclaim above previous supply.
🔴 SHORT bias continues below $0.4080.
🟢 Long only valid if bullish flip + volume returns above 200 SMA.
📊 Keywords: #XLMUSD #FadingMomentum #SMARejection #CryptoBearish #ChartPatterns #BreakdownAlert
XLM To $0.74I'm looking for XLM to continue to the downside followed by a move up. I will place a buy at the 50% fib level or in between the 50% and 61.8.

Xlm -Just hit my T2 target7/23- My first post
-Xlm was $.42
7/24- T2 (top of range) hit $.4
7/27-Pumped 15%
as anticipated
8/1 -T2 bottom Hit (WT)
Could go lower and hit WT Low...
But I love it when a plan comes together.
I hope my T3 doesn't get hit (after this bounce).
May the trends be with you.

Juicy 12hr Setup on $XLMUSDT
Decided to take this as a short-term play, level by level.
Already holding an initial position (see my previous CRYPTOCAP:XLM post), but this current setup was too clean to pass up.
Still believe CRYPTOCAP:XLM is one of those coins primed to finally break out of its multiyear consolidation—and I’m expecting that breakout to happen this year.
First TP at 62c, and letting the rest ride if momentum kicks in. BINANCE:XLMUSDT

Xlm- The wait for Target 2 is over.After a 30% dump. We have arrived.
I hope my T3 doesn't get hit, but if it does, I'll be ready to sweep up the blood in the streets.
May the trends be with you.
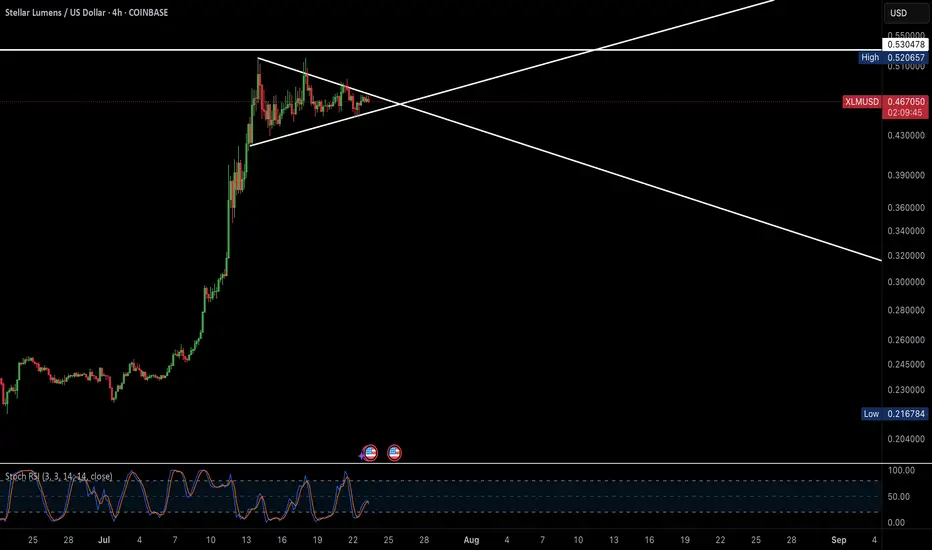
SHOULD TEST .52 AGAINWe are in a descending wedge getting ready for a squeeze. looks like we may test .52 area here again real soon. hopefully this run will have enough volume to push us to ATH. Please be aware if we break below the wedge, we could retest lower supports. It's unlikely but possible.

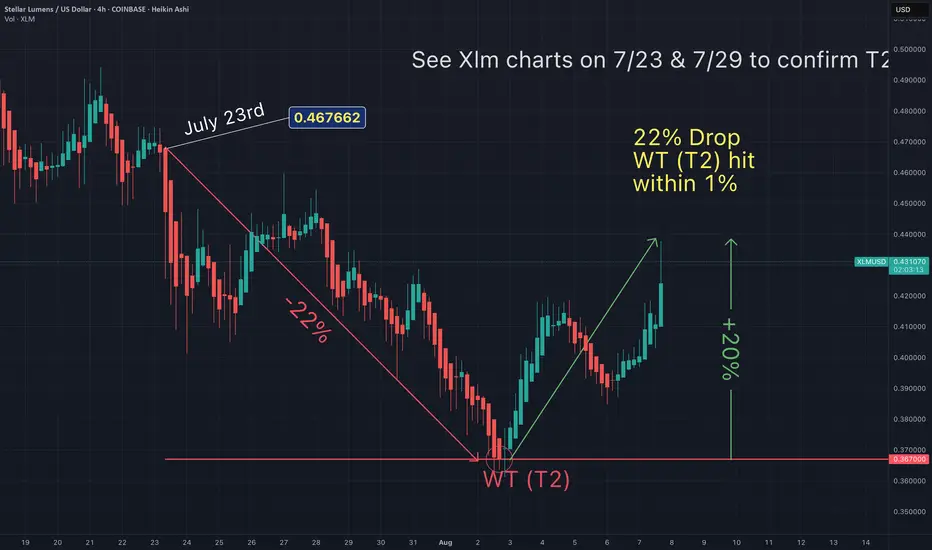
You will ask yourself "how did he know Xlm would do that"?Here's a simplified summary of my prediction made on 7/23 & 7/29 for my ideal entry.
Feel free to review my Xlm charts on those days to confirm.
I keep stats on my accuracy and so should you.
How else would you know what influencer to actually follow?
Stellar Price Faces Breakdown Risk as Short-Term Signals Flip BeBINANCE:XLMUSD.P Stellar (XLM) price is starting to flash warning signals as short-term technicals turn bearish. On the 2-hour chart, the 20-period EMA has crossed below the 50-period EMA; commonly referred to as a death crossover. This pattern often suggests a rise in short-term selling momentum, and BINANCE:XLMUSD.P is already trading just above a fragile support level near $0.38.
If $0.37 fails to hold, the next support sits at $0.33, followed by $0.28. The Bull-Bear Power (BBP) index has flipped negative, reflecting a loss of buying strength and increasing control by bears. Price action aligns with this momentum shift, signaling that buyers are struggling to defend key levels.
Sentiment data adds to the cautious outlook. According to Coinglass, 60.67% of traders are holding short positions on $BINANCE:XLMUSD.P. While this high short interest occasionally triggers short squeezes, in the current setup, it reinforces the bearish structure rather than contradicting it.
On the on-chain side, Stellar’s net exchange flows recently turned positive for the first time in two weeks. This suggests that some holders are moving tokens back to exchanges, typically a prelude to selling. For any recovery to be sustained, XLM must reclaim $0.40 and ideally break above $0.52 to shift the broader trend.
Bears Take Control: XLM/USD Struggles Below $0.40
Price has closed below the middle Bollinger Band (blue line), indicating bearish pressure.
Recent candles show rejection wicks on top and strong red-bodied candles, signaling active selling.
Support zone around $0.40 has been breached and price is struggling to reclaim it.

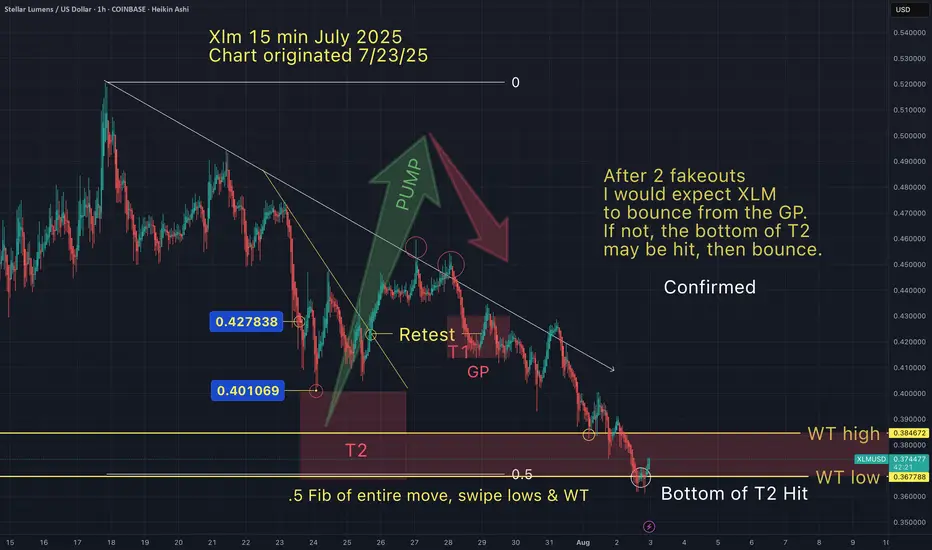
XLM target hit - But is there more downside?7/23- My first post - Xlm was $.42
7/24-Xlm hit T2 @ $.4
7/27-Pumped 15% - as anticipated (indicated on this chart on 7/23)
After 2 fakeouts I would expect XLM to bounce from the GP.
If not, the bottom of T2 may be hit, then bounce.

XLM 300+ RRXLM ridiculous RRR. 3D timeframe HVF 1.618 fib at 4.40$. Could XLM rip up to XRP prices?? Smaller timeframe W pattern with a bullish three impulse flag on the 15m. Looking for a tight stop. MEGA MOVES (usually don't work) but lets see...
XLM - Getting Ready to go BerserkAfter a huge weekly candle, XLM still holds its ground at around 0.45 - 0.47, it's quite evident that it's getting ready to prime to its next target, Stoch RSI on daily is cooling down, and market is grinding slowly, when this blows past 0.53, it essentially breaks past it's all time high, a 7 year consolidation pattern would be breaking out and heading towards the moon, Targeting $4-$6
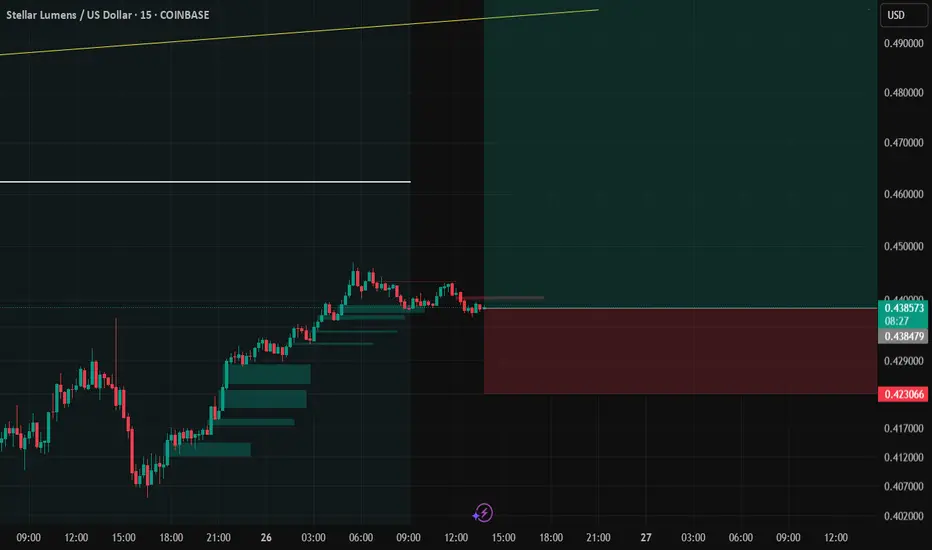
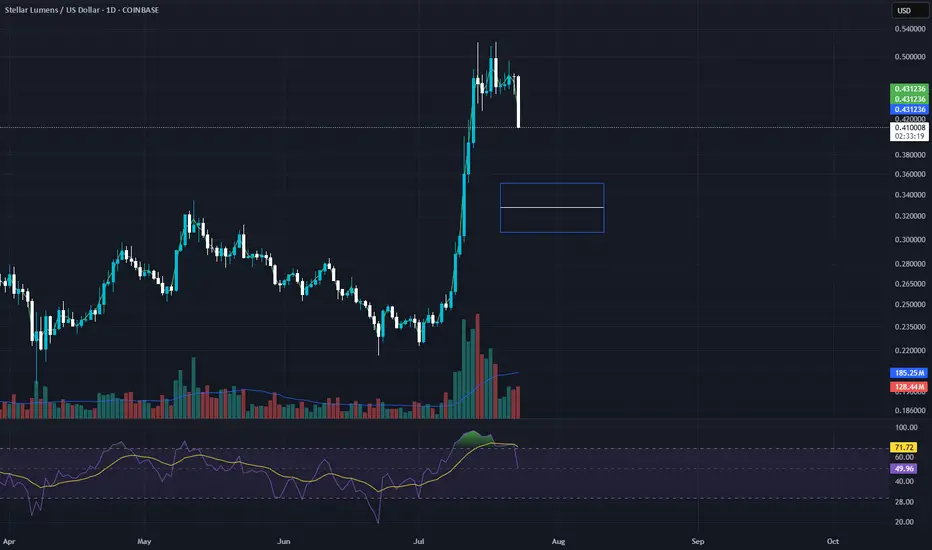
XLM/USD Entry on pullback ideaI am ooking for market to reprice XLM against USD at levels show in blue box. Could be a level to add or enter.
XLMT2 marks the spot. Final countdown before blast off.
Could always go lower, but this is where I would get on if I
didn't want to miss my ride.
All aboard, the next shuttle to the moon is about to lift off.

XLM: Bullish Pennant Signals Possible Breakout Rally IncomingXLM has formed a bullish pennant on the daily chart—a classic continuation pattern that typically follows a strong upward price surge. This formation, marked by a consolidation phase in the shape of a symmetrical triangle, suggests that buyers are briefly pausing before potentially resuming the uptrend.
A breakout above the pennant’s upper trendline would likely confirm bullish momentum, giving traders a clear signal to enter long positions. If this breakout occurs with strong volume, XLM could see an explosive move higher, potentially mirroring the size of the initial flagpole that led into the consolidation. Keep an eye on resistance levels as a break could spark the next leg up.
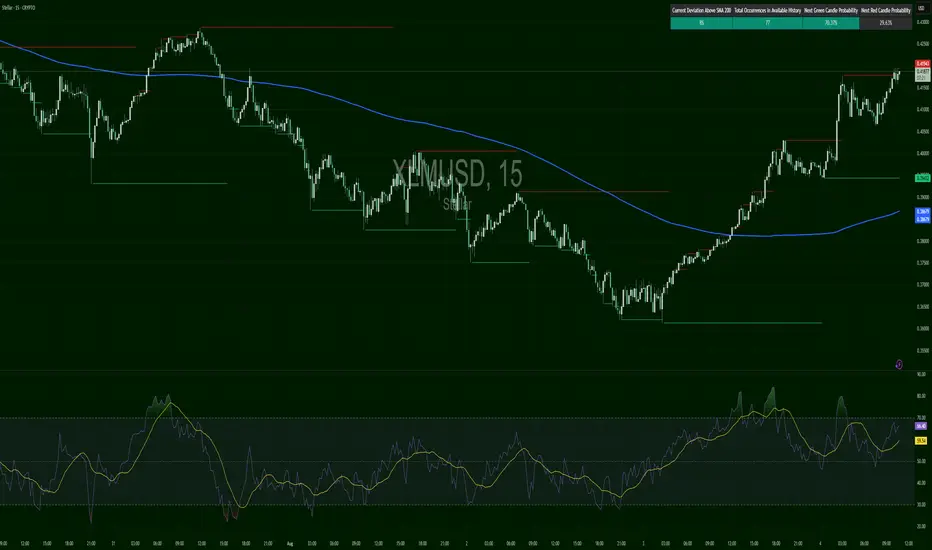
XLMUSD – Trying to Stand UpXLM fell aggressively from $0.4850 and broke below its SMA 200 for the third time in two sessions. RSI rebounded from oversold (~30), currently hovering near 42. The price is stabilizing near $0.4550 support — possible relief bounce brewing, but no higher highs yet. Caution advised.