Let's revisited fractal thesis for $XLMA while back I posted how LSE:XLM has maintained a rise in price similar to the fractal from the initial bull run.
Here below we have the dark pink fractal, green fractal and yellow fractal; all are clones of the 1st bull run.
What we see is the dark pink fractal concluding with a top about the same time the markets topped.
The green and pink fractals are placed at different support levels because I couldn't be sure which level would be more appropriate.
However, they both suggest a top around July-Sept. at a price level above 2.5.
I've also included a light pink fractal of just the legs of the bull run in case we have a similar two peaks like the first bull run, the final top would take the price above $20 and top around Mar.2025.
Obviously, past price action is not a guarantee of future movements but it's interesting to see price obey the fractal when it's approaching the final top.
I'm obviously sticking with LSE:XLM to see if it plays out are previous times, or better.
Are you?
XLMUSD trade ideas

(XLM) stellar lumens "buying moment"Looks like a good buying moment based on on balance volume, negative and postive volume all compared together in one equation. Stellar Lumens; the other cryptocurrency coin.

Support TrendlinePrice needs to close above this trend line in order for the hope of a bull market for XLM to stay alive, otherwise back to 7 cents. Hold and get rekt.

Bear Season Not Alt SeasonThey sold you the idea of alt season you believe them and they dumped on you. Somehow there are still idiots who think XLM is in a bull market. Where’s the bull market exactly? I’ve been looking for it for 3 yearz.

$XLM #XLM #STELLAR 3 LINES STORY The Stellar (XLM) network is a decentralized, open-source blockchain platform designed to facilitate fast, low-cost cross-border transactions. It was created by Jed McCaleb, one of the co-founders of Ripple, and launched in 2014 with the goal of promoting financial inclusion by connecting financial institutions, payment systems, and people. The native cryptocurrency of the Stellar network is called Lumens (XLM).
### Key Features of the Stellar Network
1. **Cross-Border Transactions**: Stellar allows for seamless and efficient international money transfers. Transactions typically settle within a few seconds and with minimal fees.
2. **Asset Issuance**: Stellar enables users to create, issue, and manage digital representations of any asset, such as fiat currencies, commodities, or other cryptocurrencies.
3. **Decentralized Exchange (DEX)**: The network includes a built-in decentralized exchange where users can trade issued assets directly on the ledger.
4. **Smart Contracts and Multi-Signature Accounts**: Stellar supports basic smart contract functionalities and multi-signature accounts to enhance security and enable complex transaction logic.
5. **Stellar Consensus Protocol (SCP)**: Instead of using Proof of Work (PoW) or Proof of Stake (PoS), Stellar uses the Stellar Consensus Protocol, which aims for faster transaction times and lower energy consumption.
### Future Abilities and Developments
1. **Scalability Improvements**: Continuous upgrades to enhance transaction throughput and network efficiency.
2. **Enhanced Smart Contract Capabilities**: Expanding the scope of smart contracts to support more complex decentralized applications (dApps).
3. **Interoperability**: Developing bridges to other blockchain networks to facilitate greater cross-chain functionality.
4. **Stablecoins and CBDCs**: Increasing support for the issuance and management of stablecoins and central bank digital currencies (CBDCs) on the Stellar network.
5. **Integration with Traditional Financial Systems**: Further integration with banks, remittance companies, and financial institutions to enhance liquidity and accessibility.
### Network Management
The Stellar network is managed by the Stellar Development Foundation (SDF), a non-profit organization that oversees the development and growth of the network. SDF supports the ecosystem by providing grants, developing tools and resources, and fostering partnerships.
### Tech Firms in the Future of Tokenized Assets
Several tech firms and financial institutions are leveraging the Stellar network for various applications:
1. **IBM**: IBM has partnered with Stellar to develop World Wire, a cross-border payments solution that uses the Stellar network to clear and settle international transactions in real-time.
2. **SatoshiPay**: A micropayment platform that utilizes Stellar for fast, low-cost transactions to enable frictionless micropayments for digital content.
3. **Tempo**: A global remittance service using Stellar to enhance its payment infrastructure, offering faster and cheaper money transfers.
4. **Circle**: Issuer of the USDC stablecoin, which operates on multiple blockchains including Stellar, enabling more efficient digital dollar transactions.
### The Future of Tokenized Assets
The future of tokenized assets on the Stellar network looks promising, with several key trends:
1. **Increased Tokenization of Real-World Assets**: More assets, including real estate, stocks, and commodities, are expected to be tokenized, offering greater liquidity and fractional ownership opportunities.
2. **Regulatory Clarity and Adoption**: As regulations evolve, clearer guidelines will likely foster broader adoption of tokenized assets by institutional investors.
3. **Enhanced Security and Compliance**: Improved security measures and compliance protocols will bolster trust in tokenized assets, attracting more participants to the ecosystem.
4. **Interoperable Financial Ecosystems**: The development of interoperable systems will allow tokenized assets to move seamlessly across different blockchain networks and traditional financial platforms.
In summary, the Stellar network is a powerful platform designed for fast, cost-effective cross-border transactions and asset tokenization. With ongoing developments and increasing adoption by tech firms and financial institutions, Stellar is poised to play a significant role in the future of the global financial landscape.

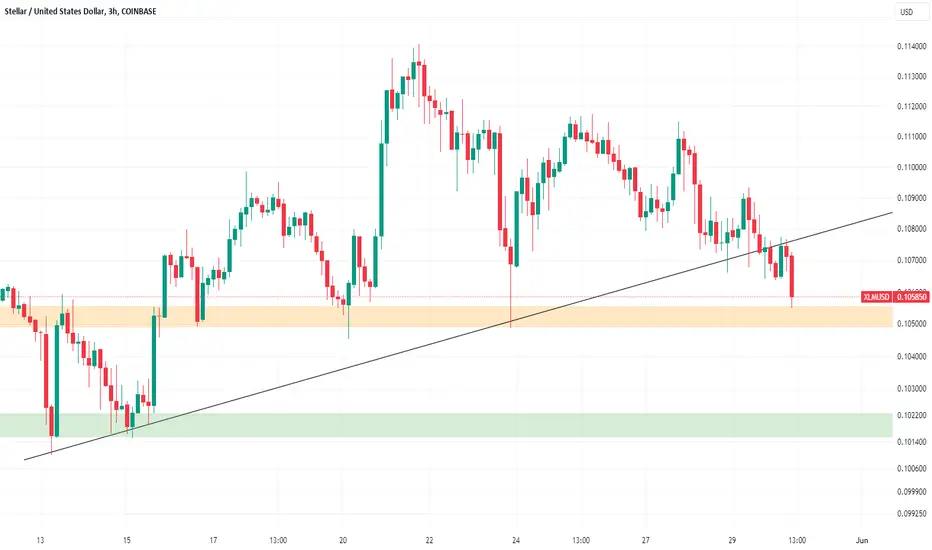
GET REKTIf we lose the orange support, next target is the green support. some say this is the perfect time to accumulate, but why would people accumulate when there is not one single bullish signal on the chart?
BEARISH DIVERGENCE?Look at all the bearish divergences on the chart leading to massive sell offs, but somehow you are made to believe by the scammers on trading view and X to keep buying and accumulate so they can dump their bags on you. this is not rocket science, it is a simple idea. you get bearish divergences on the RSI, selling pressure follows. I'm not saying this is the case 100% of the time and i hope I'm wrong, but just look at the RSI action compared to price action and draw your own conclusion instead of letting a bunch of illiterates brainwash you.

RETEST OF BREAKDOWNWhile people are busy posting bullish ideas, i'll share what people refuse to see and accept. this is a 4h chart, price has broken down below the support line, price has failed to go back above it, and the next support level is shown in orange color. while the uneducated say that the bottom is in, i do not approve or reject this notion, all i know is what i see in the chart. the chart must give us bullish signals first, but it isn't. XLM has been in a bear market since june 2021 (for 3 years). this chart cannot be in a bull market unless price surpasses 40-90 cents. traders will make money on the way up to 40-90 cents if it ever goes to those levels, but the investors and holders will get REKT waiting for new ATH.
XLM/USD: Recent Bearish Candle on 45-Minute Timeframe Stellar Lumens (XLM), the cryptocurrency known for its fast and inexpensive cross-border transactions, has recently displayed a bearish candle on the 45-minute timeframe. This has sparked some worry among traders, prompting questions about a potential downturn for the XLM/USD pair. Let's delve into this recent development and analyze its significance within the broader context of XLM's price movement.
Understanding the 45-Minute Chart
The 45-minute timeframe offers traders a short-term view of the market, focusing on price movements over a 1.5-hour interval. It allows for a more granular analysis compared to daily or weekly charts but provides less historical context than longer timeframes. A single bearish candle on the 45-minute chart signifies a price drop within that specific timeframe. However, its significance depends on several factors.
Dissecting the Bearish Candle
The interpretation of the bearish candle hinges on its characteristics. Here's what to consider:
• Candle Size: A large bearish candle with a significant price drop carries more weight than a small one with a minor price movement.
• Volume: High trading volume accompanying the bearish candle indicates stronger selling pressure, potentially amplifying the downtrend.
• Position in Trend: If the bearish candle appears during a downtrend, it reinforces the bearish sentiment. Conversely, a bearish candle following an uptrend might be a short-lived pullback.
Is this a Sign of a Trend Reversal?
A solitary bearish candle on the 45-minute timeframe shouldn't be interpreted as a definitive sign of a trend reversal. Here's why:
• Short Timeframe: The 45-minute timeframe captures a limited snapshot of price movement. Broader trends are often better identified on daily or weekly charts.
• Market Noise: Short-term price fluctuations can be caused by various factors, including random market noise or temporary imbalances in supply and demand. These may not translate into a sustained downtrend.
Looking at the Bigger Picture
To assess the potential impact of the bearish candle, it's crucial to consider the following:
• Overall Market Sentiment: Is the broader cryptocurrency market experiencing a correction, or is the bearish candle specific to XLM?
• Technical Indicators: Analyze technical indicators on higher timeframes (e.g., daily charts) to identify potential support and resistance levels.
• Fundamental Factors: Are there any upcoming events or news stories that might influence XLM's price?
What to Do?
Traders with open XLM positions should monitor the situation closely. Here are some possible actions:
• Hodl (Hold On for Dear Life): If you believe in XLM's long-term potential, consider holding your position and waiting for the market to stabilize.
• Set Stop-Loss Orders: Setting stop-loss orders can help mitigate potential losses if the price continues to decline.
• Increase Investment (For the Bold): If your risk tolerance permits and you believe the bearish candle is a temporary blip, this could be a buying opportunity. However, exercise caution and only invest what you can afford to lose.
Conclusion
The recent bearish candle on the XLM/USD 45-minute timeframe is a cause for short-term observation, not necessarily panic. Analyze the broader market trends, technical indicators, and relevant news to make informed trading decisions. Remember, cryptocurrency markets are inherently volatile, and short-term fluctuations shouldn't overshadow XLM's long-term potential as a utility-driven cryptocurrency.

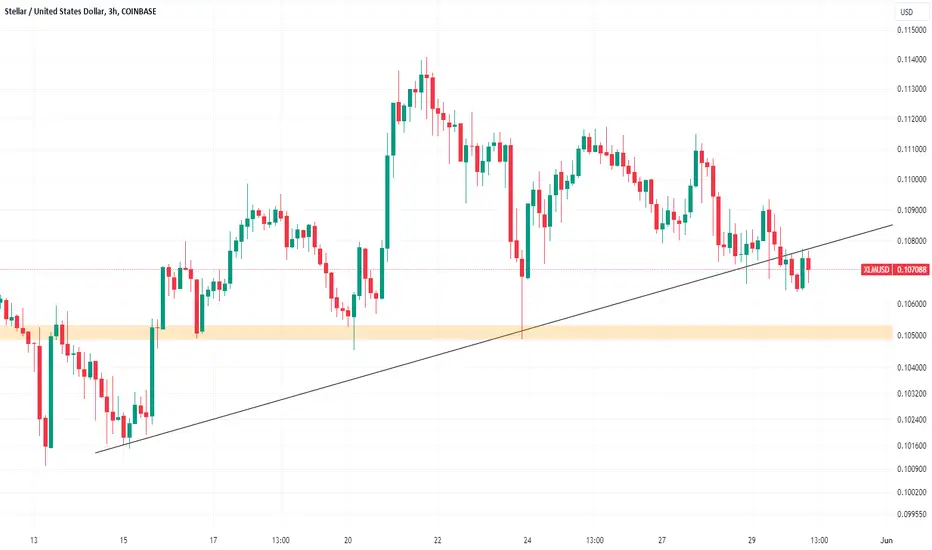
Modified TrendlineI’ve redrawn the trend line, it looks like there’s still life in turtle coin, but the lower highs are not making anything easier. A breakout is needed or price has to visit below the support trend line. The selling pressure means people have given up on this project and the only thing that can save XLM is big money from whales (I’m talking about tens of billions of dollars) to make the asset rise and save it from doomsday(price manipulation).

HODL and Get REKTYou clearly see a broadening wedge and I hope you’re not blind. If you’re not blind you will also see that price has broken below the wedge and price is trading below the support line. I want to be bullish on XLM like the rest of scammers posting bullish ideas on XLM without taking into consideration the reality. I have posted many XLM bullish ideas, but all of them have been wrong. Here I’m not analyzing or predicting anything. I’m just showing you what you do not want to see and accept. I will change my tone on XLM once I see a sign of life and bullish signals. XLM is getting slaughtered against btc, XLM is getting slaughtered against btc, XLM is by far one of the most underperforming assets in this cycle. This is not FUD, I’m only stating what has happened. Now if XLM flips and hits 38 cents, my narrative will change, but the asset shows no sign of reversal. we see bullish signals across the entire crypto but not on this shitcoin. We like to convince ourselves that XLM is a utility token and want to force ourselves to hold because of this reason. A pile of cow dong is worth more now than it did in 2021. Look at XLM with all the utility. 93 cent on 31st of December 2017, and now sitting and dying at 10 cents. I now concluded: cow dong has been a better investment than XLM and has been our performing XLM for a few years. Despite all this, if XLM manages to hit 38 cents and retests 22 cents, I’ll get back in.

XLM STELLAR SET FOR $13.77Stellar is Finally Set
Big Bags Comin'
The Can We Milk the Moon Shot to $13.77 ?

Stellar XLMXLM above each cycle trend line bottom
The Stellar Development Foundation is still working on many updates and supply just reached half 57%. There is a reason why Stellar Foundation would want to push the price to another cycle higher.

XLM Analysis | Key Levels on Weekly TFOn the weekly timeframe, a "falling wedge" pattern has formed, which is typically a bullish reversal pattern. The price is consolidating within this figure. The current situation, along with the weakening selling pressure during this consolidation phase, suggests that a bullish reversal may be imminent. A successful breakout above the upper boundary, particularly if accompanied by increasing buying volume, could propel the price towards the target range of $0.21 - $0.24. However, if the price fails to break above the resistance zone and sustain above the $0.24 level on the weekly timeframe, it may face a retest of the support level at $0.10 - $0.071. This could lead to the formation of a new lower low, potentially revisiting levels last seen in March 2020.
🔴 Key Resistance Levels: $0.21 - $0.24
🟢 Key Support Levels: $0.10 - $0.071
❕ Always remember the golden rule of investing: never risk more than you can afford to lose. Trade carefully and wisely, and may each of your transactions be successful !

MONTLY BULL FLAG....stellar big montly consolidation for trades long term , hope big investors saving money in stellar lumens big news soon will explode this one to incredible levels

XLM in weekly chart Hello
Sometimes I really prefer to simplify my chart, especially in those ones that are more complex. What is so critical in this chart (same as XRP) is a long time consolidation that is in progress yet and I guess we might see last correction for this beautiful project before it starts a massive rally.
Very very important notice:
I must re-mention that this market is young and there are much more manipulations than the other market, and it means that it might be possible some of my and other ideas become failed, and this I request you to just invest in this market and replace your trading strategies to high liquid markets, so you can rely on Mass Psychology more confidently and be protected from emotional and intentional manipulations.
If you want to see how dangerous are these markets for trade (specifically in small timeframes), there just need to put a Market sell/buy position (with 10k USD for example) in this chart or any other charts with low liquidity, in minutes timeframe, and then you will be surprised (small whale feeling ;)))))
But if you invest, then you become happy in any rise and much more happier in any correction.
Just try it once.
Thanks

Broken Support?XLM keeps on getting raped for now. XLM has another hour to close above the orange support, otherwise it may be the new resistance to deal will. So far XLM has been getting crushed by every single resistance level and everyone keeps on posting bullish ideas to spread hopium without paying attention to all the supports being broken. We all want XLM to form a real reversals and give us a bull run but so far it’s getting s***t on by the bears really bad.


More RejectionI’m trying very hard to be bullish on XLM, but it’s just rejecting every level. If it does not manage to break out from this trend line we will soon be back at 0.10 and even lower levels if we close below the 0.10 mark.

XLMUSD: Sitting Just Below The All-Time 0.886 RetraceXLM is trading just below the all-time Linear-Scale 0.886 Fibonacci Retrace after Bullishly breaking out of a Falling Wedge in what seems to be a part of a much bigger Cup with Handle pattern that can be seen in the Log Scale chart. If the Full Logarithmic Target is reached we will see XLM make a move towards $23.35 in the near future which aligns with both the measured move of the Cup with Handle and the 1.618-1.902 Fibonacci Extension Zone.

HOPIUMThe scenario i have drawn with the arrow is extremely optimistic, but i think my triangle is legitimate as they come. if we can touch the top of the triangle then 40 cents is the new support level. as of now everything and every price is acting as resistance, hence one of the most undervalued assets in this cycle.

Current Trends for XLMAfter we pass the last Friday of the month we bull so Saturday the 27th will be retail Monday will be traditional market for BTC which will drive up the market.

Just for FunXLM market cap would have to climb up to over 1 trillion dollars for the price to reach over 50 dollars. XLM is not going to these prices anytime soon (maybe 15-20 yrs later). it's just that a 161.8 % of the super wave 1 gives an estimate of 53 dollars and these parallel trend lines align with each other so perfectly that makes it look like it is a possibility for this cycle. in my optimistic opinion XLM can do 17-19 dollars this cycle, but if we want to stick the what the reality has been for the past 5-6 years, people would be happy even if it manages to barely go above 1 dollar. it is an interesting chart to study, but do not bet money on it hitting the highest trendline.
