Solana Hits Target with 9x ROI, More Upside Ahead?Solana just smashed our target, delivering up to 9x returns for those who held on. In this video, we break down the current setup, where the next 40% move could come from, and what to watch in funding rates and BTC dominance. Altcoins are waking up. Are you ready?
This content is not directed to residents of the EU or UK. Any opinions, news, research, analyses, prices or other information contained on this website is provided as general market commentary and does not constitute investment advice. ThinkMarkets will not accept liability for any loss or damage including, without limitation, to any loss of profit which may arise directly or indirectly from use of or reliance on such information.
XLMUSD trade ideas

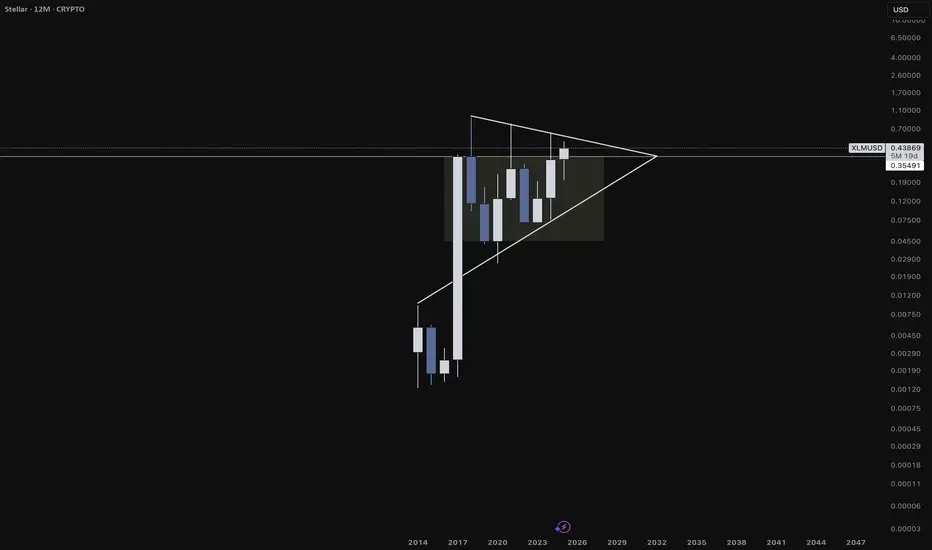
XLMUSDBullish pattern, ascending triangle with target 10usd.
We will see this target.
The only thing that matters is time.

XLM/USD XLM is showing one of the strongest bullish setups right now.
A macro “Cup”, with a smaller “Cup with Handle” forming inside it — a powerful setup often leading to parabolic breakouts.
Before a true breakout, price may fake out to the downside, trapping longs.
This is classic market maker behavior — shakeouts followed by strong reversal and breakout. Stay focused on the reaction around yellow zone.
Currently in the final stages of the “handle” formation.
A breakout may confirm a move toward $4

Stellar Sitting Mid-Range — Patience Before the Pop?XLM has been stuck in a defined range, with both the top and bottom holding multiple times. Stoch RSI is resetting, and price is nearing the midpoint again. Breakouts from ranges like this often come when traders get bored — stay alert.

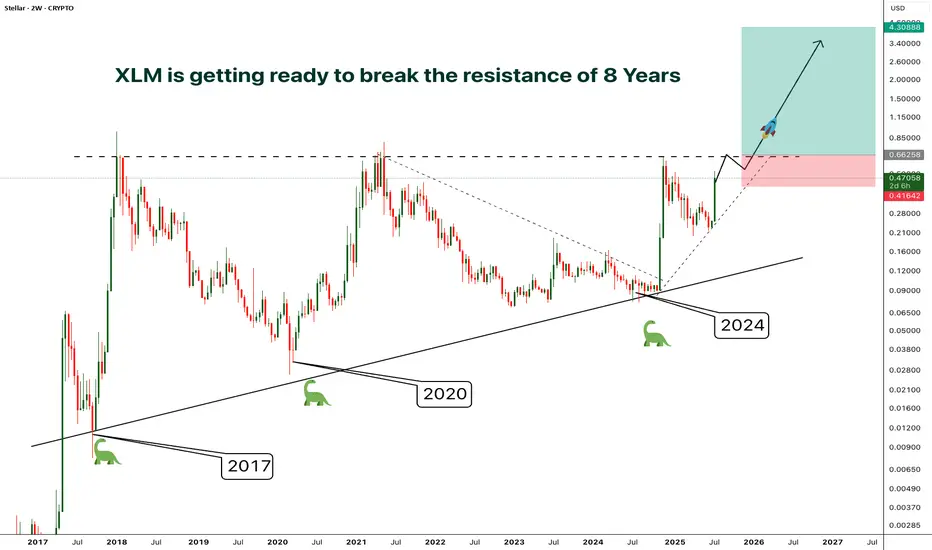
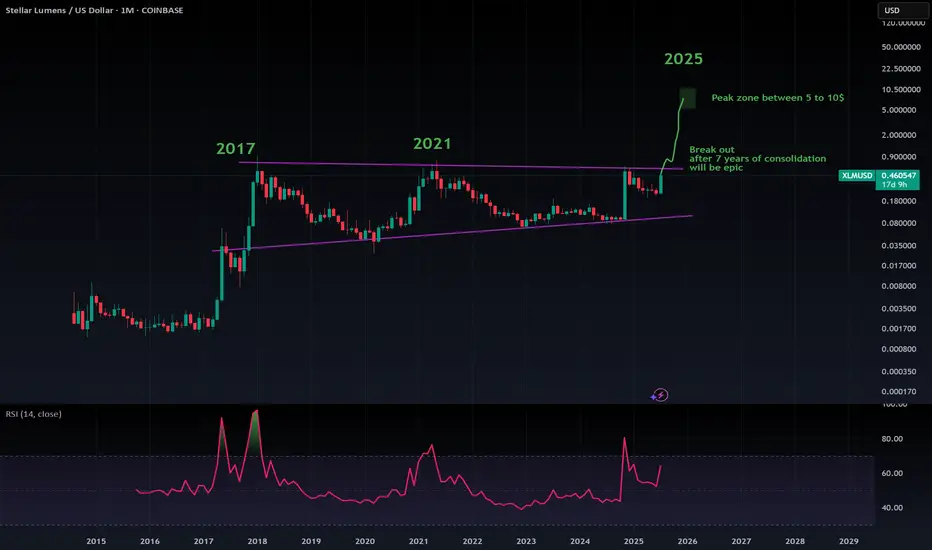
XLM - Resistance/Consolidation of 8 Years- Finally after 8 years of consolidation and getting rejected by the resistance at the same level around 0.65, XLM is preparing to break out from the almost decade old resistance
- A clear breakout from this resistance will phenomenal
- The price surge after the breakout will be unlike anything you've ever seen.
- I'm planning to enter after a confirmed breakout, entry before the breakout will be risky in case if the price gets rejected again.
Entry Price: Candle closeAbove 0.65
Stop Loss: Below 0.41
TP1: 0.88574
TP2: 1.21012
TP3: 1.92545
TP4: 2.68849
TP5: 4.27772
Don't forget to keep stoploss
Cheers
GreenCrypto
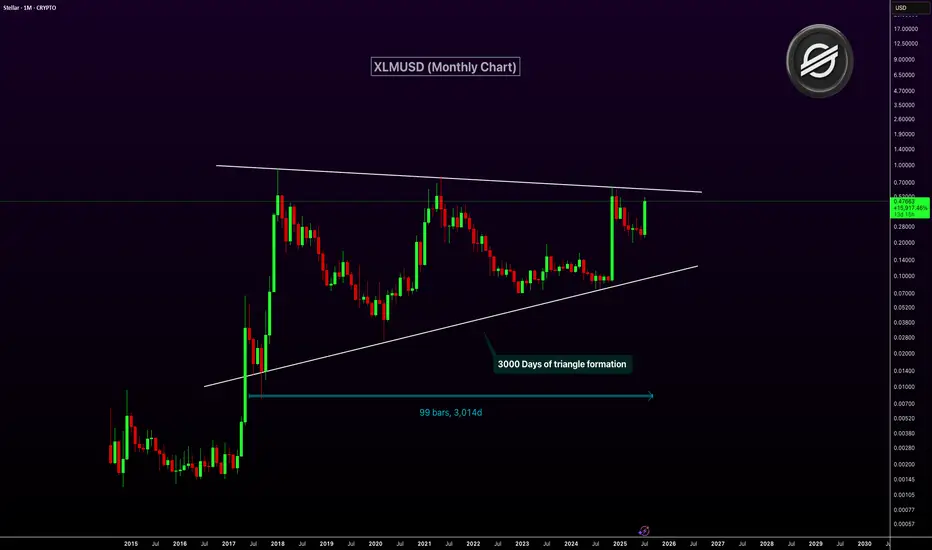
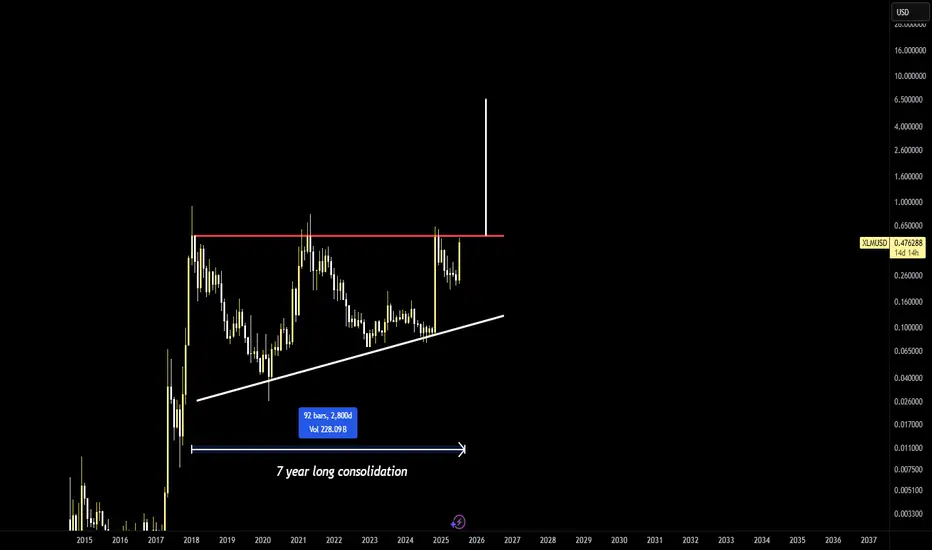
XLMUSD Nearing Breakout After 3,000-Day Triangle FormationXLM has been consolidating inside a massive symmetrical triangle for over 3,000 days. This long-term pattern on the monthly chart dates back to 2017. The price is now approaching the upper resistance trendline of the triangle. A breakout from this structure could ignite a major bullish rally.
The current monthly candle shows strong momentum with over 100% gains. A confirmed breakout above resistance could mark the start of a macro uptrend. This triangle is one of the most significant technical setups in XLM’s history.
Target 1: $1.00
Target 2: $2.50
Target 3: $5.00
WATCH OUT!!! RED ALERTStay vigilant. So many dummies out
there right now making all kinds of
ridiculous predictions. I've heard
several prophetic warnings about a
flash crash in the markets in August.
Maybe...maybe not. I will keep some
reserve USDC on the side and set my
limit orders accordingly. This is NOT
financial advice. Stay on alert here
just in case market makers try to
get everyone RRRRReKT. This would
be the 2nd candle on the weekly time
frame. Most bull cycles will produce
5 green candles on the weekly however,
I urge strong caution in the 67 cent area.
Oh...one more thang...
******* HAPPY XLM HUNTING ********

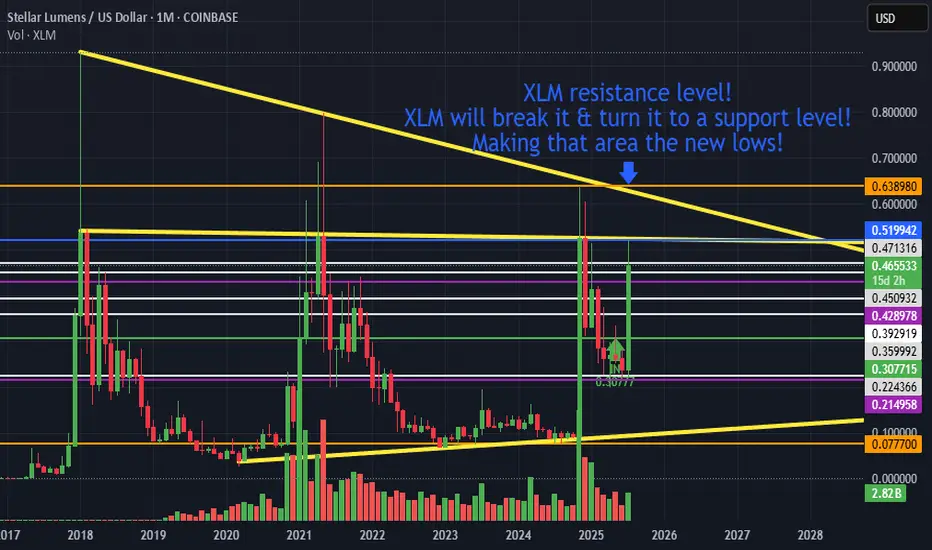
XLM new lows!XLM resistance level!
XLM will break it & turn it to a support level!
Making that area the new lows!
SEVERE Backtest ABC correctionXLM is trapped in a massive pull pennant and and ABC correction seems to be forming to backtest $0.12.
IMO, the B leg is forming.

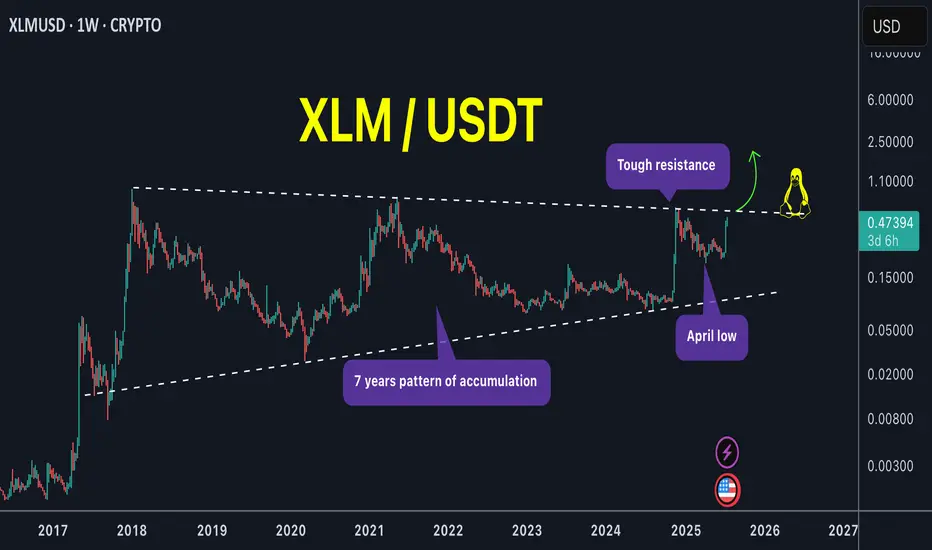
XLM is the pump over or just getting started !XLM / USDT
What a huge weekly candle! We catched its strong move very early around 0.29$ a week ago (75% profits locked in spot)
With a zoom out chart we can see price is setting up nicely with several tests of pattern boundary. Next test of the upper boundary can lead to huge breakout of this mega pattern !
NOTE: Price must not close below april low and should close above upper boundary unless that its just a range
Keep an eye on it closely !
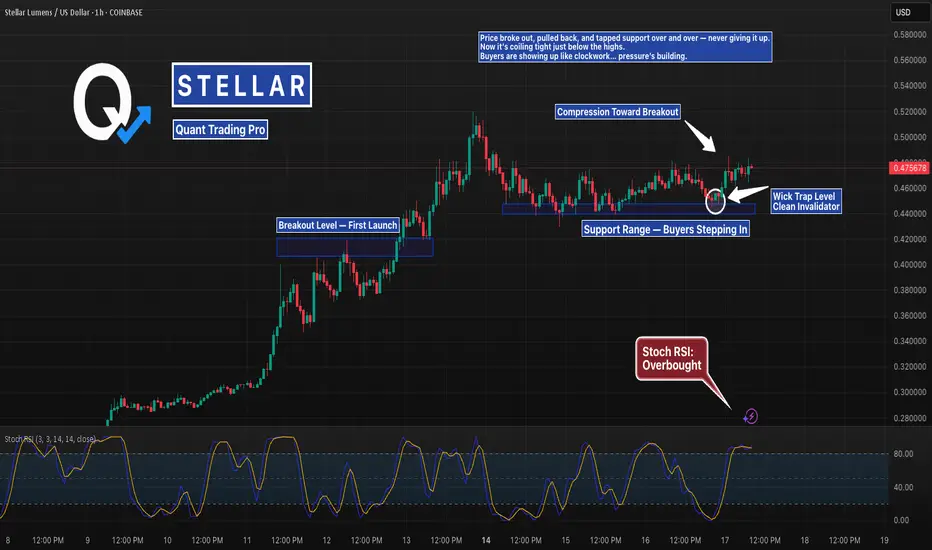
XLM Coiling at the Highs After Holding Support PerfectlyStellar broke out, then printed the cleanest support range you’ll find.
Wicks into demand, fast rejections, and now it’s compressing just under resistance.
If it breaks from here, there’s room to stretch.
But don’t forget — the longer it coils, the harder it snaps.
#XLM #StellarLumens #XLMUSD #SupportAndResistance #BreakoutSetup #CryptoCharts #TradingView #QuantTradingPro #BacktestEverything
The one chart to rule them all - Stellar- the best looking setup in the crypto market
- the trade of the cycle
- as soon as monthly closes above resistance (red) XLM is likely to skyrocket higher, much higher
- with XLM recently acting as XRP beta, it is likely this move occurs once Ripple is comfortable above its 2017 high and heads to the triangle target of 10-12$
XLM first a shortWell, looks like we had an impulsive wave up for the wave 1. Now correctiong, Looking to short for a nice 23%. The take position for the bigger and sickest wave 3.


XLM ready for break outXLM same story with XRP and LTC.
Super long consolidation pattern about to ripe off.
The easiest 10x opportunity you can find these days.
A no brainer
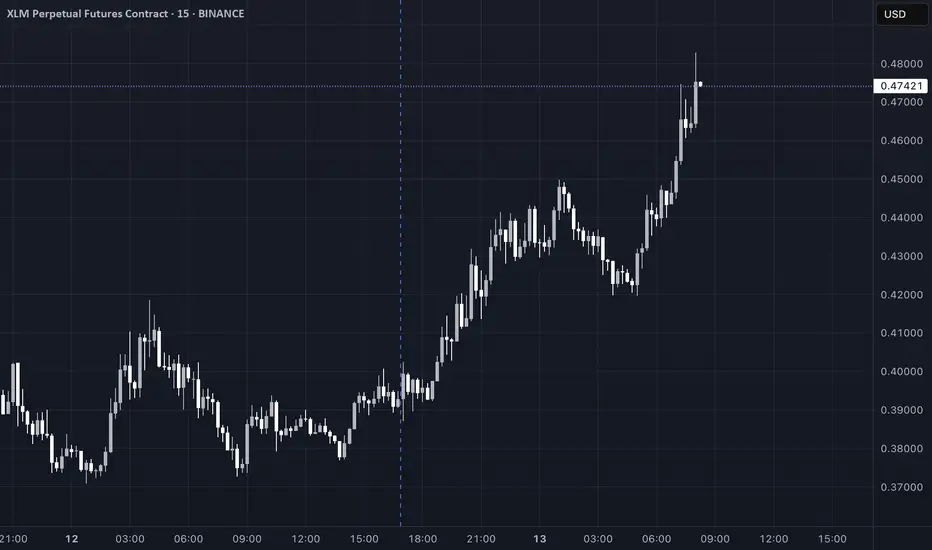
XLMUSD – Dip Bought, Bulls in Reload ModeXLM made a massive rally above $0.54 before rejecting back to $0.46. It has now reloaded and is showing a new leg up toward $0.50+. Volume is supporting the move. The key trigger is clearing $0.4920 for next extension. $0.4650 is the must-hold base.
XLM... Adam & Eve, the beginning and the end...The largest adam & eve pattern i have witnessed in my trading career. Could this play be at hand? if so... life changing money will be made.

XLM Crypto Analysis Summary (2025-07-13)XLM Crypto Analysis Summary (2025-07-13)
Comprehensive Summary of Each Model's Key Points
Grok/xAI Report
Technical Analysis: Current price at $0.47, significantly above all moving averages, indicating a short-term uptrend but overbought conditions as indicated by an RSI of 89.93. Price is outside Bollinger Bands, signaling a likely correction. Market Sentiment: Positive sentiment due to altcoin rallies, but technical overextension suggests potential for profit-taking. Conclusion: Modestly bearish outlook with a strong probability (>70%) of a pullback. Recommend entering a short position at $0.47 with a stop-loss at $0.50 and take profit at $0.40. Claude/Anthropic Report
Technical Analysis: Similar findings with price at $0.47, overbought RSI (89.93), and significant distance from the upper Bollinger Band at $0.40 highlighting significant risk of pullback. Market Sentiment: Euphoric sentiment but warns of imminent reversals due to overextension. Conclusion: Aimed for a short position as well but with a different target and stop-loss placement. Proposes entry at $0.47, stop-loss at $0.52, and take-profit at $0.38. Gemini/Google Report
Technical Analysis: Affirms the bullish trend due to price above all MAs but highlights overbought RSI and Bollinger Bands indicating a need for caution. Market Sentiment: Positive altcoin movement correlating with Bitcoin, suggesting potential for continued growth but also warns of speculative dynamics. Conclusion: Encourages waiting for a pullback to $0.40 for a long entry. Proposed stop-loss at $0.38 and take-profit at $0.50, though leaning towards caution. DeepSeek Report
Technical Analysis: Price maintains a position significantly above moving averages, and the high RSI and Bollinger Band readings indicate potential price reversion. Market Sentiment: Euphoric market sentiment, though devoid of fundamental backing. Warns of the "dumb money" effect. Conclusion: Strongly bearish for shorting at $0.47, with a risk/reward ratio emphasizing potential gains from a mean reversion. Llama/Meta Report
Technical Analysis: Confirms high prices and overbought conditions similar to others, but suggests a cautiously optimistic bullish outlook. Market Sentiment: Positive sentiment detected, yet overbought conditions imply revisiting support before new longs are advisable. Conclusion: Proposes a long trade if a pullback to $0.40 occurs, but acknowledges an overall risk assessment opposing current long entries.
Areas of Agreement and Disagreement
Agreement:
All reports recognize the overbought conditions based on an RSI above 89 and significant price movements above key moving averages. Each model finishes with a recommendation for a bearish or cautious position acknowledging the likely impending correction. Disagreement:
The nature of the recommended trade (short vs. long) varies; Grok, Claude, and DeepSeek recommend shorting, whereas Gemini advocates waiting for a long position upon a pullback, and Llama suggests a similar cautious long entry. The specifics of stop-loss and take-profit levels also vary across reports, reflecting differences in perceived market volatility and risk management style.
Conclusion
Overall Market Direction Consensus: The market is broadly seen as moderately bearish due to extreme overbought conditions, despite the bullish price trends observed.
Recommended Trade:
Trade Direction: Short Entry Price: $0.47 Stop Loss Level: $0.50 Take Profit Level: $0.40 Position Size Recommendation: 1 lot (approximately 2,128 XLM contracts at 50x leverage, given a $10,000 account). Adjust based on personal risk tolerance. Confidence Level in Recommendation: 70% Key Risks and Considerations: Potential continued upward momentum due to market sentiment, volatility causing sharp movements, and correlation with major cryptocurrencies like Bitcoin. Strong monitoring during trade execution due to high slippage risk. Trade Entry Timing: Enter at market open.
TRADE_DETAILS (JSON Format) { "instrument": "XLM", "direction": "short", "entry_price": 0.47, "stop_loss": 0.50, "take_profit": 0.40, "size": 1, "confidence": 0.70, "entry_timing": "market_open" }
📊 TRADE DETAILS 📊 🎯 Instrument: XLM 📉 Direction: SHORT 💰 Entry Price: 0.47 🛑 Stop Loss: 0.5 🎯 Take Profit: 0.4 📊 Size: 1 💪 Confidence: 70% ⏰ Entry Timing: market_open
Disclaimer: This newsletter is not trading or investment advice but for general informational purposes only. This newsletter represents my personal opinions based on proprietary research which I am sharing publicly as my personal blog. Futures, stocks, and options trading of any kind involves a lot of risk. No guarantee of any profit whatsoever is made. In fact, you may lose everything you have. So be very careful. I guarantee no profit whatsoever, You assume the entire cost and risk of any trading or investing activities you choose to undertake. You are solely responsible for making your own investment decisions. Owners/authors of this newsletter, its representatives, its principals, its moderators, and its members, are NOT registered as securities broker-dealers or investment advisors either with the U.S. Securities and Exchange Commission, CFTC, or with any other securities/regulatory authority. Consult with a registered investment advisor, broker-dealer, and/or financial advisor. By reading and using this newsletter or any of my publications, you are agreeing to these terms. Any screenshots used here are courtesy of TradingView. I am just an end user with no affiliations with them. Information and quotes shared in this blog can be 100% wrong. Markets are risky and can go to 0 at any time. Furthermore, you will not share or copy any content in this blog as it is the authors' IP. By reading this blog, you accept these terms of conditions and acknowledge I am sharing this blog as my personal trading journal, nothing more.
Here's Why XLM is on the Verge of a Massive breakoutThe next 10 years of success for the Stellar Network (XLM) are being shaped by decisions, developments, and trends happening right now (2024–2025). Here’s a breakdown of the long-term shaping factors currently in motion that will influence Stellar's trajectory through 2035:
------------
🌍 1. Real-World Use Cases Being Built Now
Stellar is not waiting for hypothetical adoption — it’s already deploying use cases that are foundational to its future success.
Examples:
MoneyGram Access gives real people the ability to cash in/out of crypto in over 180 countries.
USDC on Stellar enables stablecoin remittances with instant settlement and low fees.
Stellar Aid Assist provides governments and NGOs a working model for humanitarian digital cash aid.
Long-Term Impact: Building trust and infrastructure in the real world now means exponential network effects later — especially in emerging markets where crypto utility > speculation.
-------------------------------------------------------------------------------------------
🛠️ 2. Soroban (Smart Contracts) Rollout
Stellar is rolling out Soroban, a Rust-based smart contract platform that will transform the network into a programmable blockchain.
Why Soroban is Important:
Enables DeFi, lending, NFTs, on-chain identity, and DAOs.
Designed for predictable gas fees, making it ideal for finance and compliance.
Makes Stellar more competitive with Ethereum, Solana, Avalanche, etc.
Long-Term Impact: Soroban turns Stellar into a platform where real, decentralized applications can live — critical for long-term value capture and developer retention.
-------------------------------------------------------------------------------------------
🌐 3. Laying Global Payment Infrastructure
Stellar is quietly building global payment rails through partnerships with:
Fintechs (MoneyGram, Leaf, Settle, Cowrie)
Stablecoin issuers (Circle for USDC, Novatti for AUDC)
Payment aggregators in Africa, Latin America, Southeast Asia
Long-Term Impact: By 2030, these partnerships could evolve into a globally interconnected network of on/off ramps, anchors, and stablecoins. This gives Stellar real utility far beyond speculation.
-------------------------------------------------------------------------------------------
🏛️ 4. Regulatory Alignment & Compliance Tooling
The Stellar Development Foundation (SDF) is heavily involved in regulatory dialogue, including:
Working with the BIS Innovation Hub and IMF working groups
Building on-chain compliance tools (e.g. KYC/AML anchor guidelines)
Developing the Stellar Disbursement Platform, which complies with aid distribution requirements
Long-Term Impact: As crypto becomes more regulated, networks that built with compliance in mind will thrive. Stellar is positioning itself as a compliant blockchain for finance, especially for governments and NGOs.
-------------------------------------------------------------------------------------------
💸 5. Tokenization of Real-World Assets (RWAs)
The future of blockchain is heading toward tokenizing everything — and Stellar is already positioning itself at the front of that movement.
Franklin Templeton tokenized a U.S. mutual fund on Stellar.
Stablecoins like USDC and native fiat tokens are in active use.
Discussions are ongoing around CBDC pilots and tokenized bonds.
Long-Term Impact: The network that supports the most trusted tokenized assets — from CBDCs to real estate to securities — will gain enormous value from volume and liquidity. Stellar is in that conversation now.
-------------------------------------------------------------------------------------------
🧠 6. Mission-Aligned Ecosystem Funding
The Stellar Development Foundation holds billions of dollars in XLM and is using it to:
Fund early-stage startups building on Stellar
Run accelerator programs and hackathons
Expand into new regional markets (Africa, Asia, LATAM)
Long-Term Impact: Unlike many ecosystems that fizzle due to lack of funding or misaligned VC interests, Stellar has long-term strategic capital to guide the network toward its mission of financial access.
-------------------------------------------------------------------------------------------
🔐 7. Security, Speed, and Simplicity
From day one, Stellar has prioritized:
Fast block finality (~5 seconds)
Very low fees (< $0.001)
Energy-efficient consensus (SCP – Stellar Consensus Protocol)
These strengths are especially important for high-volume, low-margin applications like:
Micropayments
Remittances
Real-time settlements
Tokenized wages and aid
Long-Term Impact: As the blockchain infrastructure layer for finance matures, efficient networks will dominate. Stellar’s technical foundation makes it a sustainable long-term option.
-------------------------------------------------------------------------------------------
🧭 8. Stellar’s Focused, Long-Term Vision
SDF’s mission isn’t to be “just another smart contract chain” — it’s to improve access to equitable financial services, especially in underbanked regions.
That vision is:
Clear
Consistent
Attractive to partners, governments, and NGOs
Long-Term Impact: Clarity of mission = better talent, partners, funding, and resilience during market cycles.
-------------------------------------------------------------------------------------------
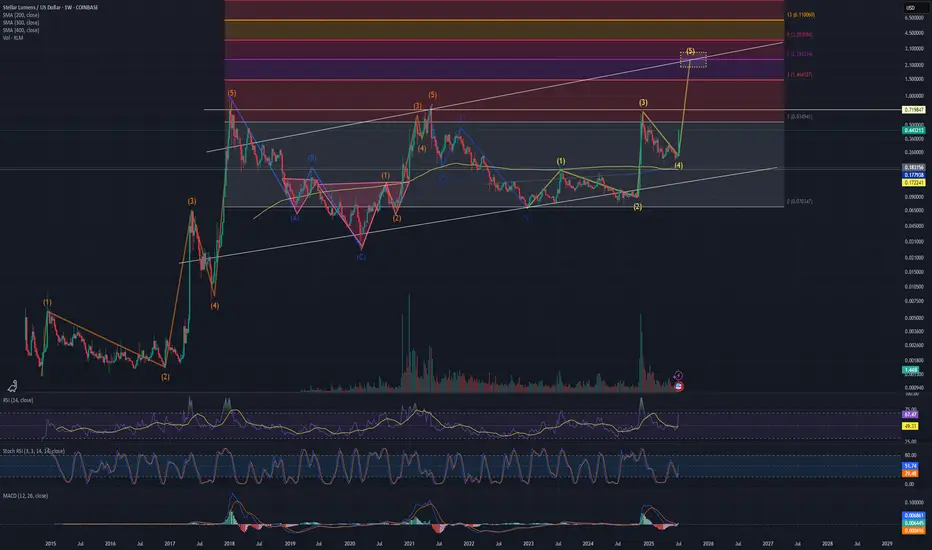
XLM to make a new ATHStellar XLM looks like its on the move to make a new All Time High.
Prediction is that XLM will break out from its 70c resistance and make a new all time high of at least $1.46 and potential to $2.39 with $3.70 being moonshot targets.
XLMUSD inv h&s at the threshold of the necklineNo confirmation yet but market currently feeling very bullish here. Likely to breach this neckline in the next few candles. *not financial advice*

#XLM/USD - SHORTI won't specify the timing and goals here, but I think it's enough to take precautions and avoid becoming food.
At this stage, there is a hidden bearish divergence and a global extended bearish divergence, and neither of them has even started to develop.
At this stage, the decline is caused by approximately 7 factors, one of which is the Gartley butterfly pattern.
I'm sure no one on the Internet has noticed that the asset has no bullish factors for growth, but there are many bearish factors.
The ratio is:
11 bears vs 0 bulls.
(I have provided 2 out of 11)
If anyone has any bullish factors that they have heard of or know about, please let me know in the comments, but please avoid using hamster triangles or anything similar, as it does not make sense in this game.
(Not an investment recommendation).

XLM BUY SETUP ,Bought From $0.37800XLM BUY SETUP
Currently $0.37800
Bought From $0.37800
(Trading plan If XLM go down to $0.36
will add more longs)
Expecting target $0.40 OR ABOVE
In the event of an early exit,
this analysis will be updated.
Its not a Financial advice
