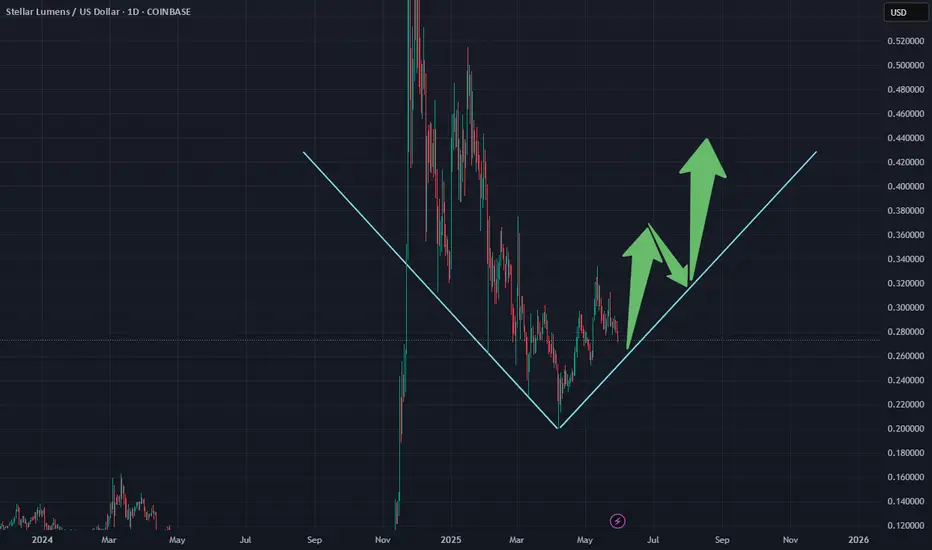
BE VIGILANT HEREWith the unrest in the Middle East
we are testing the lower support
band on XLM. My worry here is we
break the lower line of confluence
and it becomes resistance. If so,
I would plan on taking a HUGE long
margin trade on XLM around .1203
I have my BUY limit 20x orders set
@ 12 cents. Not financial advice.
USE your best judgement here and
be patient and wait for price to come
to you! Chill out in this area. A retest
of .36 cents would be a HUGE positive
for XLM however, there could be quite
a bit of volatility in the coming months.
Good Luck and...
********* HAPPY XLM HUNTING *********
XLMUSD trade ideas

XLM - ready for last leg upXLM is repeating impulsive pattern from 2017. After creating accumulation range we got the breakout, formation of bull flag which tested top of accumulation range and we are now ready for last leg of this impulsive move. In 2017 last leg went equal meassured move target aka fibb 2.0 extension. Same move in current conditions will bring XLM price to 2$ range.
RSI also confirms this move. After hitting RSI overbought +90 level we got a pullback to middle 40 range - same move we did in 2017 before last leg up - this RSI also implicating one more push to RSI +90 overbought conditions and then big correction back to oversold conditions - if price will sit above diagonal resistance line at that moment that will be super bullish....

Bidding XLM Under 30c – Easy 2x From here!
Bidding this area under 30c—starting to like how things are shaping up.
Easy setup, especially with BTC aiming for 110k again.
If momentum fades and the market pulls back, I’ll cut and look to re-enter sub 20c on a key retest.
CRYPTOCAP:XLM gets really interesting above 65c—if it breaks that, expect strong follow-through. BINANCE:XLMUSDT

XLM break out ??Potential break out of falling wedge for XLM
Larger Volume on break a good sign, has retested breakout level.
needs to start moving higher and break that second consolidation zone or risks falling back into old patten.
what do you think? leave a comment.

Long on XLM — Breakout Brewing?Stellar (XLMUSD) just pushed above the Ichimoku Cloud with conviction and strong daily momentum. Price action is clean, riding above the Tenkan and Kijun lines, and volume is picking up. A close above $0.31 could confirm a breakout toward $0.44, with a longer-term extension possible to $0.62 — nearly a 2x move from current levels.
Technical Highlights:
✅ Ichimoku breakout: clear sky ahead
✅ Higher highs and higher lows
✅ Bullish momentum across MACD + structure
📈 R1 Target: $0.44
🛰️ R2 Target: $0.62
🛑 Stop: Below $0.27
If Bitcoin holds steady, XLM could run hard. Watching for continuation above $0.31 with volume. Let’s ride the wave. 🌊
#XLM #Stellar #Crypto #Altcoins #Ichimoku #Breakout #TradingView

Points of deflection...AKA "BOUNCE"Bounce baby..that's right!...not Beyonce!...BOUNCE!
XLM on the move UP. Don't be troubled
by BTC's retest of the 100k area. That
is healthy and we should see a strong
bounce around that 100k zone. Time to load
up on your favorite ALTCOINS. As the old
saying goes...a rising tide raises all ships.
Wait till this baby really takes off! This is
just a rough estimate as to where price could
bounce in the next week or two. Not much
time left in this bull cycle. Don't buy into the
"this time is different" BS. We will probably top
out around October 2025 so I will be positioning
myself early on these trades and taking profits
along the way UP. Good luck and....
********** HAPPY XLM HUNTING **************
XLMUSDT short Wait for Good EntryLike & Follow me for more details
GLMR Short,
BTC will break upward trend soon.
Will reach 103k

XLMUSD Huge breakout may happen any moment.Stellar / XLMUSD is testing the 6 month Falling Resistance again, while trading inside a Channel Up.
The 1day RSI is in strong support of this move and may force a 1day candle closing above the Resistance finally.
If it happens, go lonh and target 0.3650 (+32.79%).
Previous chart:
Follow us, like the idea and leave a comment below!!

XLM/USD Stellar Heist: Snag the Bullish Breakout Loot!🚀XLM/USD Stellar Surge Strategy🚀
Hello, Wealth Warriors & Market Mavericks! 💸 Ready to conquer the Stellar vs. Tether (XLM/USD) crypto battlefield? 📊 This *Cosmic Trading Blueprint* fuses razor-sharp technicals with real-time market pulse to chase a bullish breakout. Follow this strategy, ride the wave, and exit before the Danger Zone strikes. Let’s bag those profits as a squad! 🤝🎯
📈 **Strategy Snapshot: XLM/USD Stellar**
- **Market**: XLM/USDT (Crypto) 🌍
- **Bias**: Bullish Breakout ✨
- **Timeframe**: 6h (Swing Trade) ⏳
**Entry Points** 📡
- **Breakout Entry (Entry 1)**: Spot the breakout above the 50-period MA at 0.33500 and dive in—stellar gains await! 🚀
*Smart Tip*: Place buy stop orders above the MA or buy limit orders at the latest 15/30-min swing low for pullback entries. 🔔 Set a TradingView alert for the 0.33500 breakout to stay ahead of the game!
- **Pullback Entry (Entry 2)**: Wait for a dip near 0.32500, confirmed by bullish price action, for a safer entry. 📉
**Stop Loss** 🛡️
- **Breakout Traders**: After breakout confirmation, set Stop Loss below the recent 1D swing low at 0.28000 to guard against reversals. ⚠️
- **Pullback Traders**: Adjust Stop Loss based on risk tolerance (e.g., 1-2% of account), factoring in lot size and multiple entries. 📏
- **Risk Note**: This trade’s high-energy! Keep position sizing disciplined to protect your capital. 🔥
**Target** 🎯
- Aim for 0.45000, near the Danger Zone (overbought area prone to consolidation or reversal). 🏁
- **Exit Strategy**: Take profits early if bearish signals (e.g., high volume, reversal patterns) emerge near 0.45000. 💰
**Scalpers** 👀
- Target quick long-side scalps with tight trailing stops. Pair with swing traders for the full strategy or snag fast profits if capital allows. 💵
📊 **Why This Trade Shines (May 18, 2025)**
XLM/USDT is poised for action, driven by:
- **Technicals**: Breakout above the 50-day MA (~0.33500) with higher lows on the 4h chart signals strong momentum. 📈
- **Sentiment Analysis (May 18, 2025)**: Web sentiment shows 70% positive buzz for XLM, with altcoin hype growing. Fear & Greed Index at 74 (Greed), urging caution near overbought levels. 😎
- **Fundamentals**: CFTC’s COT report (May 16, 2025) indicates a 10% WoW increase in institutional long positions in crypto futures, reflecting big-player optimism. 📰
- **Seasonal Advantage**: Q2 historically boosts altcoins, aligning with this setup. 📅
- **Market Dynamics**: USD weakness (DXY down 0.9% this week) and altcoin strength fuel XLM’s upside. 🌎
⚠️ **Risk Management: Secure Your Gains**
- **News Caution**: Avoid new trades during high-impact events (e.g., CPI, FOMC) to dodge volatility spikes. 🗞️
- **Trailing Stops**: Activate trailing Stop Loss as price approaches 0.42000 to lock in profits. 🔒
- **Position Sizing**: Limit risk to 1-2% per trade for a steady strategy. 🚨
💥 **Launch the Surge!** 💥
Join the *Cosmic Trading Blueprint* crew—like, comment, and follow for more dynamic trade setups! 🚀 Your engagement fuels our market quests, driving precision wins. Let’s crush XLM/USDT together! 🤝🏆🎉
**Stay Ready**: Another stellar plan is in the works. Keep your charts primed, traders! 🐱🚀😎
📡 **Real-Time Data (May 18, 2025, UTC+1)**
- **XLM/USDT Price**: ~0.33200 (aggregated exchange data).
- **COT Report (May 16, 2025)**: Institutional long positions in crypto futures up 10% WoW, per CFTC.
- **Sentiment**: 70% positive, Fear & Greed Index at 74 (Greed).
- **USD Index (DXY)**: Down 0.9% WoW, supporting altcoin momentum.

XLMUSD Long - Inverted Head and Shoulders on the daily
- Price is re/testing the neckline of the H&S
- 20ema is now trading above the 50ema (good indication of a possible up trend starting)
- Stop loss below the higher low
- take profit around 0.35 possibly higher

XLM: The bull flag that wants $1.50Time Frame: Midterm (expect to close before end of 2025
Entry point: 19-33c
Exit: $1.40-$1.50
Stellar, often seen as a younger brother of XRP, hasn’t seen much of the spotlight from its more well known older brother, but has performed better than almost all major currencies since the Trump election win in November 2024. Where as ETH and other currencies are performing poorly since Trump’s election win, Stellar has performed amazingly and still 200% up from Nov 5th 2024. So with that great gain already, why does Ralfetto believe there is more to come?
So what is XLM?
XLM, is an open-source, decentralized payments network. It uses blockchain technology to allow users to transfer funds quickly and at a very low cost. The payments network does not show preference to any national currency; instead, the network has its own native cryptocurrency, Stellar Lumens.
So why is XLM worth investing in?
Firstly, at Ralfetto, our views are our own and we are just providing our thesis why we like it, your investment decisions are your own. We are of the belief that XLM will be part of the new X/Grok ecosystem as its payment option. We see alot of evidence pointing to it (alongside XRP). XLM is also ISO compliant which makes it one of a few that supports this technology.
What is the chart telling us?
XLM looks like a bull flag with a target to push it to $1.5. With that type of move, we do expect some fall back given a 5x return.
How we are investing
We believe XLM/Stellar will reach two major targets within 3 years. The first in 2025 of $1.40-150 which is our take profit level 2. After that we expect some volatility before it reaches its final destination of $4.50. There may be further upside but we will be having moving stops once it hits both targets.

XLM Breaking Up StructureXLM will melt faces this bull run, Expect Higher Prices Soon.
Not Financial Advice.

I just got in XLM!XLM broke the resistance trendline!
Around 6 months I been waiting for this! lol
XLM RISE!

#XLMUSD Daily Analysis — Falling Wedge Breakout with 1x-2X Poten🌟 #XLMUSD Daily Analysis — Falling Wedge Breakout with 1x-2X Potential
🗓 Published: May 10, 2025
📊 Timeframe: 1D | Exchange: Coinbase
🔍 Technical Overview
Stellar (XLM) has broken out of a multi-month falling wedge, confirming a bullish reversal after forming a strong base near $0.20. The breakout candle cleared structure resistance and flipped trend momentum back to the upside.
📌 Setup Highlights:
✅ Confirmed Falling Wedge Breakout
✅ Retest held at wedge apex + support = bullish continuation
✅ 50 MA starting to curl upward
✅ Structure shows clear AB=CD continuation pattern
🟦 Key Support Zone:
$0.201255 — Wedge base and breakout origin
Panic Level: Close below $0.2510 = invalidation of bullish leg
📛 Breakdown = re-entry near $0.20 or wedge retest
🎯 Upside Targets:
TP1: $0.3880 – mid-channel structure
TP2: $0.4881 – key resistance + supply rejection zone
TP3: $0.5965 – full extension / wedge target
📈 R:R for this move: ~5.37x with 95% upside from current levels
🧠 Strategy Insight
• Setup favors holding or adding on dips above $0.31
• SL below $0.25 protects structure
• Ideal for spot accumulation with partial TP along the way
💡 Falling wedges with clean breakouts like this historically lead to explosive rallies — especially in major altcoins with network adoption.
🗣 What’s Next?
Reclaim of $0.38 opens up a clean run toward $0.48+.
As long as $0.25 holds, bulls are in full control.
📢 XLM is no longer sleeping — the wedge snapped, and the runway is clear. Targets are on the table.
we ask Allah reconcile and repay


XLM/USDT Breakdown: Structure Shift & Bearish Retracement Setup🚀 XLM/USDT Trade Outlook 🔎
I've been reviewing the XLM/USDT pair, and it's showing a very familiar setup compared to other majors. 🔁 On the daily timeframe, we've seen a notable shift in structure, with a clear break to the downside. 🧱📉 Dropping into the 4-hour chart, that structural break is even more apparent, adding confidence to a bearish bias. 🔍
Currently, the pair is extended away from value—and I’m anticipating a pullback into the fair value zone, where I’ll be watching closely for a potential short setup. 📐💼
🎯 In the breakdown video, we cover:
The prevailing trend context 🌊
How market structure is unfolding across timeframes 🔂
Price action cues to validate the setup 🎥📈
Key support and resistance areas for both entry and target planning 🎯
For risk management, I’m positioning the stop above the retracement high, using roughly 2x ATR for calculated protection 🛑⚙️. A potential reward could extend to 5–6x ATR, depending on how price reacts around prior structure levels on the left. ⬅️📊
As always, I’m cross-checking with my Fibonacci levels for extra confluence—and the alignment here is looking solid. 🔢🧲
Remember, this is not financial advice. Always do your own due diligence. ⚠️💡📉

XLMUSD: Aggressive surge expected to at least 0.5500Stellar (XLMUSD) just turned bullish on its 1D technical outlook (RSI = 55.377, MACD = 0.005, ADX = 37.056), extending the rebound on its 1W MA50. The long term pattern is a Triangle so for the medium term the upside is limited to 0.55000. Since however the structure from mid 2024 resembles late 2016 onwards (price rising then pulling back to the 0.5 Fib), we expect a rise to the 1.618 Fib (TP = 2.5000) if the price crosses above the LH trendline.
## If you like our free content follow our profile to get more daily ideas. ##
## Comments and likes are greatly appreciated. ##

Can Xlm break the channel and revisit highs? Xlm has been in correction mode for a while now and appears to be breaking out of its channel. A break out could send Xlm to 0.53.

RE: Stellar XLM to $33. Loooong.@Agent_of_Maat posted this Jun 2, 2023, these levels looks good and have help up over the last 2 years.
ORIGINAL CHART:

RE: XLM/USD Main trend. Timeframe 1 week. Channel. @SpartaBTC's chart from Mar 20, 2022 still holds true with the levels drawn. Good job @SpartaBTC looking forward to staying up to date with this chart.
Original Chart:

RE: XLM Stellar 2025 price target of $34@altcoinb published this Dec 21, 2022. I tweaked the chart a little but over all it seems like a good chart. I don't see $34 this cycle but maybe $3.40 is on the table what do you think?
Original Chart:

RE: XLM - Stochastic RSI bullish cross w/Falling Wedge pattern?@jaydee_757 chart from Mar 3, 2022 looks like levels still may be playing out.
Original chart below:

Nov 9, 2021 chart still usable in 2025@readCrypto's chart from Nov 9, 2021 showing the levels he picked up on in 2021 are still true for this cycle. Look how each level will hold and when it breaks it goes right down to next level and is true for peaks. Great charting, looking forward to staying up to date with this one.
Original chart below:
