Weekly BottomXLM hit the bottom of the weekly range, with bullish divergence and BTC restarting a potential bull run.
XLMUSD trade ideas

XLM - CUP & HANDLE FOMC making me excited and bullish on Crypto by the looks of these charts.
i know numbers here look absolutely crazy, but lets wait and see if we hold support and break trend!
also seeing XLM/BTC & ETH it sure looks good
Trade safe all.

XLM Stellar Lumens Expected Move - XLMBTC XLMUSD XLMUSDTXLM Stellar Lumens Expected Move - XLMBTC XLMUSD XLMUSDT

XLM/USD Monthly Long term viewAs shown on the chart, I am taking this bullish view on XLM and the cryptomarket in general - as you can see on the monthly chart we have just tapped into a monthly order block and rejected from 50% retracement of the candle of the order block. I will take the first month as indecision and this month as bullish confirmation as we go into April - I am seeing some medium term bulls enter back into the crypto space and this trade is more than worth the risk - best case targeting a weekly order block level back in May 2021.
As we are seeing some positive fundamentals for crypto and BTC leading the push upwards - some altcoins could be in for a much needed recovery before the whole market cools off for a year or two.
Good luck!

XLMUSD Could Go Parabolic with a 3,000+ Percent Potential Gain! The last time XLM was this bullish it rallied 3,000% back in 2020 in roughly 365 days. If this were to hypothetically happen again, then we would reach roughly $7.00+ a coin. The stellar foundation is a major player in the crypto space and totally overlooked in my opinion. Read more about their project here: www.stellar.org
#thedailyinvestor

XLM - Stellar Moon Shot - New ATH Soon Here I have my next idea. XLM!
This is a long term idea.
To start :] we have a higher lows uptrend. Will it continue upwards momentum?
I drew out all the main resistances and support lines. I believe certain altcoins are completing a cup and handle on the monthly and weekly charts.
XLM should hit the target around $4.00. I believe that the appreciation value hasn't reached the blow off top yet for XLM.
This is just an idea and not advice on investing nor trading. Do your own research and thinking before investing or trading volatile assets.
Who's holding?

XLM LONG TERM.XLM long term prediction. " Stellar is an open-source network for currencies and payments. Stellar makes it possible to create, send and trade digital representations of all forms of money—dollars, pesos, bitcoin, pretty much anything. It’s designed so all the world’s financial systems can work together on a single network." (source: www.stellar.org)

Stellar Lumens Bull Run To Continue Signs of accumulation between .15-.20. If this bull run can push over .80 then the next Target $1.85 = major fib level

XLMUSD ❕ stoppedThe price has slowed down and is preparing to reverse from the level.
I'm expecting a fall.
Have a nice trade!
Your Solldy

XLM LONG POSITION SHORT TERMWe just bounced off of a strong demand zone, XLM has a strong correlation with XRP and since XRP is rising we are expected to see XLM rise as well, Our targets are at liquidation zones that market made by going down.
Indicators:
AROON: Already is showing strong bullish momentum
EMA: We just crossed 50 EMA zone that shows bullish momentum
Bollinger bands: We bounced off of a bottom Bollinger band.
Entry: 0.206510
Invalidation: 0.160401
Target 1: 0.257
Target 2: 0.3064

If You'd Bought $100m Worth of Stellar (XLM) 5 Years AgoKey points
Stellar allows you to create and send digital representations of any type of money.
A $100m investment in this cryptocurrency five years ago would now be worth over $940m.
Fans of Stellar believe it still has plenty of room to grow, but like all cryptocurrencies, it's a risky investment.
Launched in 2014, Stellar (XLM) is an ambitious project designed to make it fast and cheap to transfer any kind of currency. Even though its price isn't anywhere close to its previous highs, it has still paid off for anyone who got in early.

XLMUSD ❕ stoppedXLM stopped near the resistance.
I'm expecting a bounce.
Have a nice trade!
Your Solldy

XLM are you ready?We still have 1 or 2 days. If the green candle manages to close above the orange resistance, historical resistance, and break the blue descending trendline that we have been carrying with us since May 2021, well, I'm positive for the future.

XLM; Bottom is in…see next 2 major take profit levelsThe bottom is either in or very near for XLM…based on FIB Channel
Next 2 take profit levels are 0.35 & 0.44.(see chart)

XLM Long Idea**not financial advice**
XLM has a potential to run to all-time highs and beyond. Just set and forget. Bags packed, not looking back.

Craving XLMDaily chart if you can read it. The successful reader will see RED Daily trend lines hidden in the patters. Dont give in to the patterns, your money depends on it. Also, mental or physical health does too Stay focused.

BIG PictureJune 1st, 2023 is the 1:1 time extension from wave A. That means that around that date, we may be at a very good price to buy. It doesn't need to do a full extension, but harmonics usually like these things to line up in some relative fashion. This is why we use the fibonacci sequence. I've noted some relative buy zones in the green boxes. Laddering buys is usually recommended by professionals.
Alright now let me first say that I think Stellar is the real deal, and for good reason. They are one of the only projects completely focused on developing their regulatory compliance while innovating on the network and encouraging new developers to work with them. The "Clawback" (Transaction Reversal) technology is next level, and not something that other blockchains are capable of doing right now. This is a big step in maintaining compliance and being able to actually integrate with conventional regulatory backdrops. Stellar is the dark horse in crypto.
Now, that being said, Biden just released his executive order on crypto.
We are seeing more headwinds than tailwinds right now, so I expect there to be more price declines as exchanges leave and projects shut down that cannot comply with regulatory requirements*. I will note that we are already seeing announcements of projects (YFI/USDT) shutting down 25 apps/projects with seemingly no notice or good reasoning besides the fact that the developers just got bored! That's Not Good! It seems the fakes and non-committed projects are going to start cracking and running away so be careful out there.
The stock market and bond markets are beginning crashing. This first leg down the bias has still been positive, but now the "buy the dip" mentally is fading and prices at the grocery stores and pump are going up!
The market bias is now starting to flip bearish which will drive the major indices tumbling as the Fed starts raising rates. This all will drive crypto lower as liquidity leaves the systems. I expect you will all see prices you never thought you would see again, but I can't guarantee that.
My advice to any holders is HODL, as long as you're not using leverage or loans or anything. Like I said, prices could fall extremely dramatically because the levels of liquidity via margin debt and leverage that is in the system right now is unprecedented. You need to remember though that if you're a long term holder, this is not a project you should be selling ever IMO. I expect XLM to go to $30 over the next 10 years, so this is gonna be a ride of a lifetime if you can hold on throughout.
This is not trading or financial advice. I'm not telling you to sell any XLM or buy any. I am saying that it could go to 8 cents or maybe even 4 or 5 cents and if it does...I would borrow and invest Heavily at that point.

XLMUSD ❕ bounced off supportXLM bounced off support.
I expect a slight upward movement.
Have a nice trade!
Your Solldy


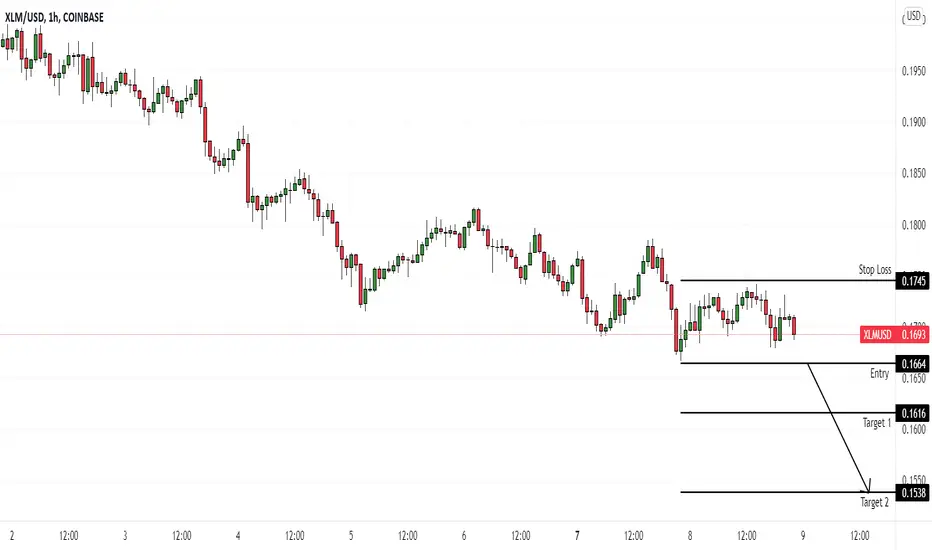
XLMUSD (1H) Bearish reversalHi Traders
XLMUSD (1H Timeframe)
The market is in a downtrend and we are waiting for an entry signal to go SHORT below the 0.1664 support level. Only the upward break of 0.1745 would cancel the bearish scenario.
Trade details
Entry: 0.1664
Stop loss: 0.1745
Take profit 1: 0.1616
Take profit 2: 0.1538
Score: 7
Strategy: Bearish reversal
XLM Squeeze On The WeeklyPrice squeeze in a massive falling wedge on the weekly. Looking for signs of reversal...

XLM/USD - Static/Dynamic SR LevelsCurrent outlook on XLM/USD pair using both static and dynamic SR trendlines. Reversal incoming??

Stellar (XLM) - March 7Hello?
Traders, welcome.
If you "follow", you can always get new information quickly.
Please also click "Like".
Have a good day.
-------------------------------------
(XLMUSD 1W Chart)
(All: )
If it falls below the 0.16420803 point, there is a possibility of entering the mid- to long-term investment area, so careful trading is required.
It must move above the 0.23438790 point to turn into an uptrend.
-----------------------------------------------------
(XLMBTC 1W chart)
(Full )
You must climb over 0.0000 1288 to get out of the bottom section.
------------------------------------------
We recommend that you trade with your average unit price.
This is because, if the price is below your average unit price, whether the price trend is in an upward trend or a downward trend, there is a high possibility that you will not be able to get a big profit due to the psychological burden.
The center of all trading starts with the average unit price at which you start trading.
If you ignore this, you may be trading in the wrong direction.
Therefore, it is important to find a way to lower the average unit price and adjust the proportion of the investment, ultimately allowing the funds corresponding to the profits to be able to regenerate themselves.
------------------------------------------------------------ -------------------------------------------
** All indicators are lagging indicators.
Therefore, it is important to be aware that the indicator will move accordingly as price and volume move.
However, for convenience, we are talking in reverse for the interpretation of the indicator.
** The MRHAB-O and MRHAB-B indicators used in the chart are indicators of our channel that have not been released yet.
(Since it was not disclosed, you can use this chart without any restrictions by sharing this chart and copying and pasting the indicators.)
** The wRSI_SR indicator is an indicator created by adding settings and options to the existing Stochastic RSI indicator.
Therefore, the interpretation is the same as the traditional Stochastic RSI indicator. (K, D line -> R, S line)
** The OBV indicator was re-created by applying a formula to the DepthHouse Trading indicator, an indicator disclosed by oh92. (Thanks for this.)
** Support or resistance is based on the closing price of the 1D chart.
** All descriptions are for reference only and do not guarantee a profit or loss in investment.
(Short-term Stop Loss can be said to be a point where profit and loss can be preserved or additional entry can be made through split trading. It is a short-term investment perspective.)
---------------------------------
